Brexit news
The post-Brexit Trade and Co-operation Agreement between the UK and the EU, which had been operating provisionally since January, was formally ratified by the European Parliament at the end of April. MEPs voted overwhelmingly for the trade deal by 660 votes to 5.
The agreement now comes into force despite reservations on both sides about fishing rights and the difficulties over Northern Ireland trade. The first of, no doubt, several stand offs occurred just a few days after the Agreement’s ratification, resulting in warships being deployed to protect the Jersey fishing fleet. Ironic, as Jersey is neither part of the UK nor in the EU, but is a Crown dependency so is defended and represented internationally by the UK government. Gunboat diplomacy at its most basic!
A reminder that the trade deal covers the trade in goods only and we await any news on future trade between the two on the likes of financial services.
Meanwhile trade between the two recovered in February after the significant drop the month before. UK exports to the EU jumped by 46% in February after January’s 42% fall. It does, though, mean than exports are still down roughly 15% over the first two months of the year. While some of the reduction in trade was down to added bureaucracy, many companies were bringing forward business ahead of the implementation of the new rules, thereby increasing trade in late 2020 at the expense of trade in the early months of this year.
The UK and India have announced a new, enhanced trade deal between the two countries, with the aim of doubling trade by 2030. And hopes of a deal with the US have risen with the American Secretary of State, Antony Blinken, suggesting that the dialogue between the countries could be revived.
Global economy
It is now just over a year since the World Health Organization declared Covid-19 a global pandemic. Many lives have been lost, economies shattered and billions spent on protecting jobs and businesses but much, too, has been achieved in the last 13 months, none more so than the rollout of several vaccines at record pace. However, many hurdles and uncertainties remain.
Infection rates and mortality rates are still stubbornly high in many countries and vaccination programmes are not progressing as quickly as desired in some countries. Yet there is much reason for optimism about the near term.
The vaccination programmes should lower future infection rates. Economies, businesses and individuals have adapted remarkably well to the constraints imposed while the massive fiscal support that many countries have employed, and are still doing, brings a more positive feel for economic activity.
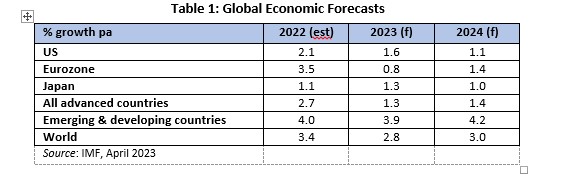
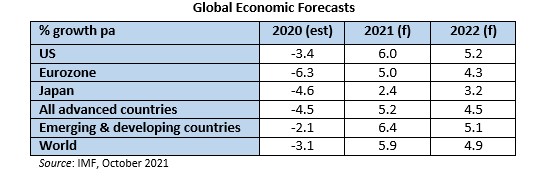
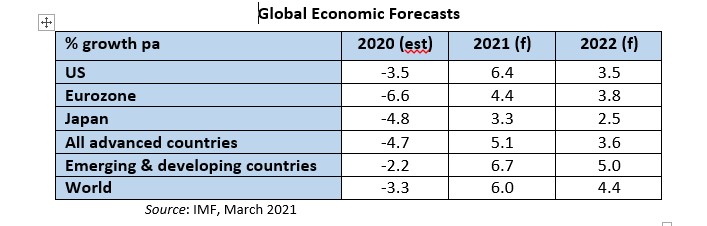
We are now forecasting a stronger recovery this year and next for the global economy compared to our forecast three months ago, although the upgrade is substantially brought about by the better growth prospects for the US. We are now expecting world growth to be 6% this year and 4.4% next year, an increase of 80 and 50 basis points respectively from the January forecast.
Forecasts for the US have increased significantly since our previous report. Our expectation for growth this year has been hiked from an already strong 5.1% to our present 6.4%. Next year’s forecast has been upped by one percentage point to 3.5%.
Much of these increases are on the passing of the ‘American Recovery Plan’ act. The £1.9tr package is one the largest in US history and includes $1,400 payments to every US citizen, an extension of unemployment benefits and a child tax credit. It is estimated that this stimulus is in itself responsible for adding one percentage point to expected global growth over 2021 and 2022 combined.
Not content with seeing through the Recovery Plan, President Biden is now proposing an even bigger $2.3tr package to upgrade the country’s aged infrastructure and in tacking climate change. It is likely that will be financed through raising corporate taxes and increasing public spending and these features alone will alienate Republicans. The Democrats are divided over the magnitude of the proposals so Biden will have his work cut out to ensure this policy is passed.
It is evident that the pace of recovery is differing significantly not just across countries but also within countries. Much of these divergences can be linked to the varying pace of vaccination, although the extent of economic policy support and other structural factors (most noticeably, countries depending on tourism) are relevant. Already China has surpassed its pre-Covid level of GDP, the US is now forecast to do so later this year, but many others may take up to another two to three years to regain their pre Covid levels of activity.
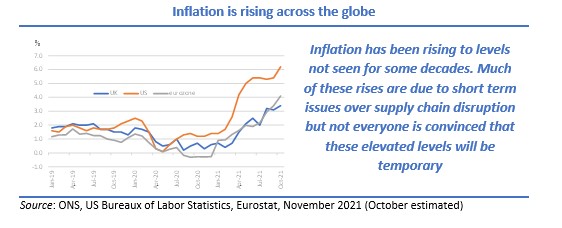
Of increasing concern is the probable return of inflation. Already energy prices are increasing (oil prices have trebled over the course of the last twelve months), commodity prices are rising and while there is no prospect of inflation increasing anywhere near levels seen in the 1970s and 1980s, rates moving above the 2% levels central bankers have been targeting are likely. Some US investors are already putting money into inflation-linked government bonds, a sure sign of their concerns over the re-awakening of inflation.
The EU economy
In contrast to the booming US economy, the eurozone’s economy fell back into recession in Q1, 2021. An overall 0.6% shrinkage in the latest, January to March, quarter followed the 0.7% reduction in Q4. These last two quarters’ contractions marked the second such recession for the eurozone (defined as two successive quarterly declines in GDP) since the onset of the pandemic.
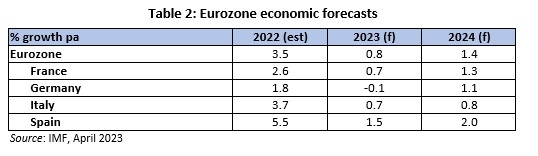
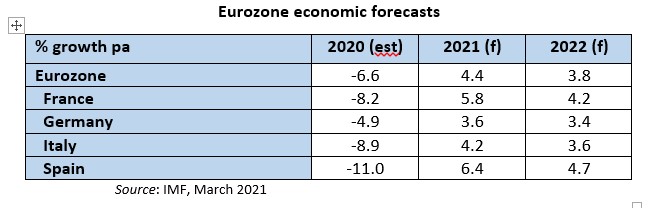
The first quarter’s data has clearly been affected by the renewed surge of Covid-19 infections and the resultant restrictions imposed but it is also evident that different countries have been experiencing differing levels of, and timings of both rising infections and tighter restrictions. To date, only Italy of the larger continental economies has plunged into recession this time, having contracted in both the last two quarters. France, Germany and Spain have managed to post growth in one or other of the last two quarters.
Germany was the most affected large economy in Q1 with a 1.7% contraction. A hike in value added tax in January following a temporary cut last year to support the economy was a key contributing factor in the decline.
Much of the pessimism about the near-term performance of the economy across continental Europe relates to the slow roll out of the vaccination programme. At the date of publishing this report, vaccines have been administered to approximately 30% of the EU population, compared to 46% in the US and 53% in the UK. Comparing the number of individuals who have received both doses, the EU (roughly 10%) trails the US (32%) and the UK (26%) (source: Johns Hopkins University).
Despite the job retention schemes that were introduced last year, unemployment increased over the summer of 2020. The unemployment rate for the euro-area peaked at 8.7% in August. It has fallen back to 8.1% or 13.2m unemployed. Over the course of the last twelve months, unemployment has increased in the euro-area by 1.6m.
The UK economy
The outlook for the UK looks brighter now than at any time during the Covid period. While activity has undoubtedly been affected by the most recent lockdown, businesses have adapted more effectively to the latest restrictions, thereby ensuring that the hit to the economy during the most recent lockdown is much less than during the initial one in Spring 2020. Then, the economy shrank by roughly 20%: contrast that with the first estimate of a 1.5% hit during the post-Christmas lockdown.
There are three main reasons for the improving confidence in the economy – the aforementioned business resilience, the rapidly improving rates of business and consumer confidence brought about by the rapid rollout and acceptance of the vaccination programme and the belief that UK consumers will soon be spending at least some of their accumulated cash savings. Continental Europeans must be looking enviously across the Channel at the speed of Britain’s vaccinations given their much discussed problems.
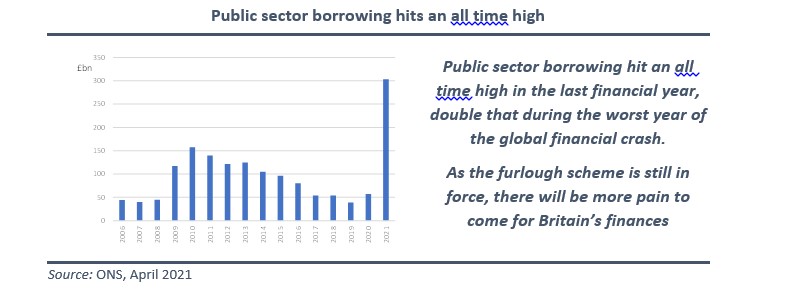
That is not to say that the UK is completely set fair. News that public sector borrowing hit £303bn for the year to March 2021 is a sobering reminder of the economic cost of the pandemic. That huge figure is almost £250bn higher than the total for the previous (pre-Covid) total and double that of the 2009/10 year at the height of the global financial crash. However, even that huge level of borrowing, equivalent to 14.5% of GDP, is still £24bn lower than the Office of Budget Responsibility had forecast just a few weeks earlier at the time of the Budget.
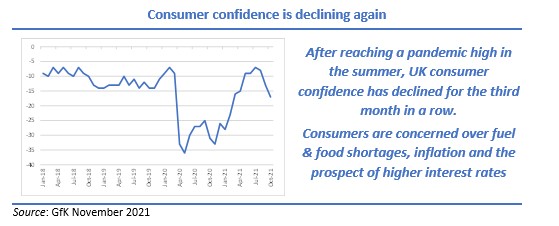
Consumer confidence hit a pandemic high in March while the re-opening of non-essential shops in April was eagerly anticipated by the frustrated shoppers. Additionally, a Deloitte survey showed that optimism amongst chief financial officers (CFOs) has risen to a record high. The same survey showed that CFOs have moved from defensive strategies to expansionary ones. Much of this optimism is down to the amount of savings the typical consumer has built up over the last twelve months. Many commentators believe that Britain is poised for a consumer boom. And judging by the lengthy queues pictured outside Primark, to name just one retailer, when it re-opened, few would bet against that expectation.
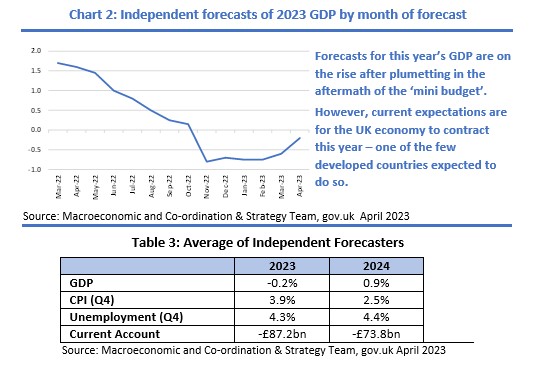
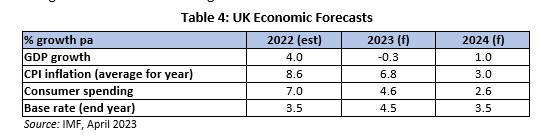
The UK’s GDP fared better than expected during Q4 2020, posting growth of 1.0% when most were anticipating contraction. The first estimate of a 1.5% contraction in Q1, encompassing a full three months of lockdown, was better than expected. And forecasts for Q2 and later are being upgraded almost daily. The IMF forecasts growth of 5.3% this year followed by 5.1% next. These have been increased by 80 and 10 bps respectively from last quarter’s report. More optimistic forecasts from Deloitte, Capital Economics and EY published in late April suggest that cumulative growth rates over this year and next could be up to 3 percentage points higher. The latter two named indicate that the UK will surpass its pre-Covid level of GDP in the second quarter of next year. As we go to print, the Bank of England has added to the good news by intimating that the UK is poised to grow by 7.25% this year, the fastest rate since comparable records began in 1949.
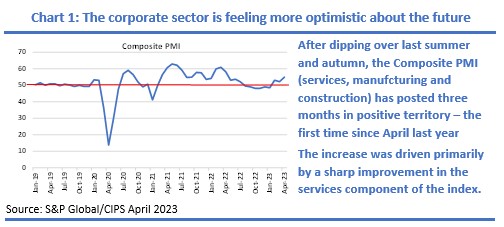
Further good news appeared with the news that the UK service sector, which accounts for over three-quarters of the UK economy, recorded its fastest rate of growth since October 2013 according to the widely respected IHS Markit/CIPS purchasing managers’ index for April. The latest monthly index of 61 was significantly above the previous month’s 56.3 and was the highest for over seven years. Tim Moore, economics director of IHS Markit welcomed the news, adding that the “April data illustrates that a surge in pent-up demand has started to flow through the UK economy, following the loosening of pandemic conditions”.
The feel-good factor has also manifested in a boom in house sales and house prices. House price growth usually moves in tandem with the economy; rarely do house prices rise during recessions, and if so, then not at the rate seen this year. Yet that is what has occurred. Over the last twelve months, average house prices increased by 8.2% (source: Halifax) while homeowners borrowed a record £12bn more than they repaid in April – the highest monthly amount borrowed in the 28 years that the Bank of England have been monitoring mortgage statistics. The pandemic may be responsible for some of this, with homeowners seeking to move to more appropriate houses but of equal importance are the low interest rates and the stamp duty holiday which has now been extended for home buyers in England, Wales and Northern Ireland.
Much of the optimism surrounding the UK economy is based on the expectation that, now the vaccination programme is progressing well and the government’s ‘roadmap’ out of the restrictions is seemingly on track, Britons will spend much of the savings they have accrued during the last twelve months or so. Survey data indicate that consumers have amassed between £150bn and £180bn since the start of the pandemic. Clearly not all will be spent – the Bank of England reports that consumers have been repaying non-mortgage debt in ever-increasing amounts – but retailers are eagerly awaiting a significant proportion of that being deployed to bolster retail spending.
Nevertheless, unemployment has been rising over the course of the last year, but at a somewhat lower pace than initially envisaged. At the onset of the pandemic, commentators were predicting that the unemployment rate would rise to 9%. To date, that figure looks particularly pessimistic, with 4.9% currently unemployed which is up from 4.0% prior to the pandemic. However, the test is still to come when the furlough scheme ends in September. Currently, there are 4.7m workers on furlough; not all businesses, particularly those in the hospitality industry, will emerge unscathed when restrictions are fully relaxed, and unemployment could take another lurch upward in the autumn.

The Commercial Property Market
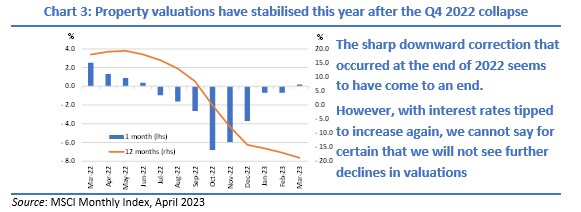
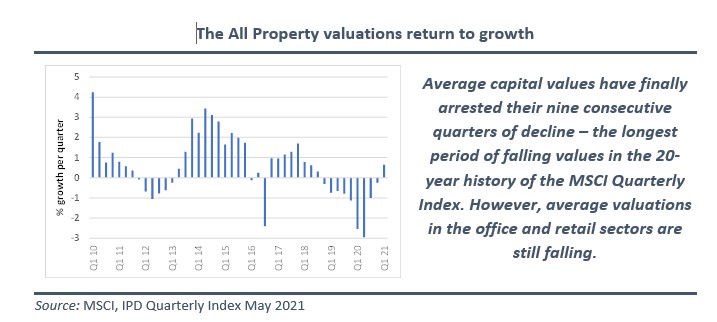
The commercial property market, as measured by the MSCI (IPD) Quarterly Index, returned to growth in Q1 2021 with a small but noteworthy increase in capital values of 0.64%. This quarter of growth therefore ended a nine-quarter decline in average property values, the longest in the 20-year history of the index.
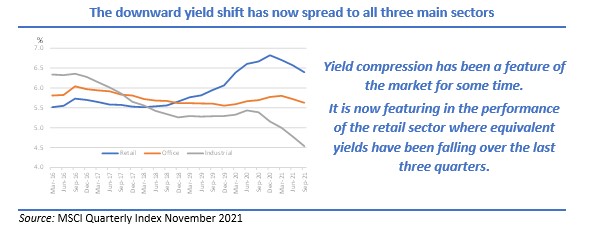
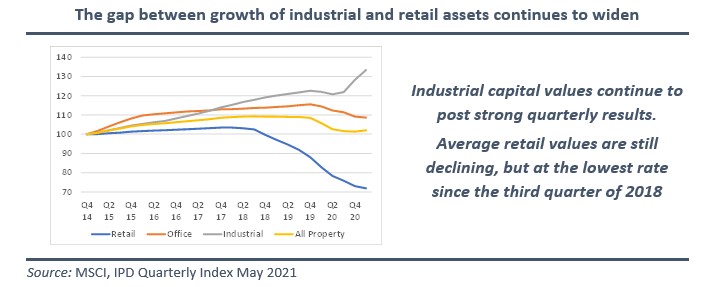
But the fact that it was the All Property measure that returned to growth is only half the story. Once again, the industrial sector was the star performer with average values rising another 4.0% in the quarter. This advance was sufficient to carry the rest of the market as average office and retail valuations continue to fall. There was a noticeable reduction in the magnitude of the decline in average retail valuations – the Q1 decline of 1.51% being the lowest since Q3 2018 when retail values were just starting to decline.
And though it is tempting to believe that the worst is behind the commercial property market, and that, now the All Property valuations are moving up, future quarters will show further growth, that certainly cannot be guaranteed. Much will depend on how many businesses survive the coming months, particularly when the various job retention schemes and loans to businesses end in the autumn. Further bad news on the jobs front is certain over the course of 2021 and although the debate about the future of retailing and home working will be heard for some time, sentiment will sway with every major announcement.
Valuations of industrial assets continue to rise. The 4.0% increase in average valuations in Q1 took the last twelve-month increase to 9.3%, remarkable at a time of major economic challenge. The sector has clearly benefited from investors’ flight to safety, with logistics assets in particular being perceived as much safer investments than office or retail.
In contrast, average retail assets continue to see valuation declines. But the Q1 fall is the lowest since the third quarter of 2018. Within the retail sector, shopping centres continue to show extremely weak returns. A Q1 fall of 7.9% brought the twelve-month decline to over 28% and to a massive 55% since average valuations started their decline in 2016. There is better news about retail warehousing. A small 0.25% fall in Q1 brought the fall over the last year to a more modest 10%. Now that non-essential shops have re-opened, retail warehouses could be the retail segment where valuations are poised to recover first. Consumers, generally, remain reluctant to shop in crowded indoor malls, despite the safeguards put in place, whereas the outdoor setting of retail parks poses shoppers less issues. Add the segment’s link to house furnishings and DIY, these assets could well start performing.
While it is easy to believe that all forms of retail are suffering, supermarkets are clearly bucking the trend. An increase in average supermarket values of 1.9% took growth over the last twelve months to 5.5%. Not quite at the standard of industrial assets, but welcome nonetheless.
Tied in with the weak performance of retail assets is the continued shrinkage of the high street. The Local Data Company (LDC), which has been tracking shop openings and closures for some time, reported that 2020 was the worst year on record for closures – 17,532. And what made last year even worse was the fact that only 7,655 shops opened, the lowest number on record. Not surprisingly, the net shrinkage – the difference between the number which closed and which opened was a record high.
Emphasising how unusual last year was for retailers, city centres suffered the greatest number of closings (7.7% of the existing stock). London postcodes also fared badly with a closure rate of 6.9%. At the other end of the table, seaside towns and villages enjoyed the least number of shop closures, at 5.1% and 4.1% respectively. LDC note that this is a reversal of historical trends. For years, multiple operators have opened more sites in cities and closed units in smaller towns. As consumer and location preferences have changed over the course of the year, retailers are now preserving locations they regard having more potential in any post-pandemic environment.
Capital values across all office segments fell in Q1 but by less than 1%. This continues the robust performance of the office sector during the pandemic with average values having fallen by just 5% over the last twelve months. Perhaps surprisingly, central London offices, in particular City offices, are holding their values better than provincial ones. Over Q1, the average values of City offices were trimmed by just 0.2% for an annual decline of 2.2%. Contrast that with the capital value performances of rest of south east and rest of UK offices which saw average declines of 0.6% and 0.8% in the quarter and 5.3% and 4.1% over the year.
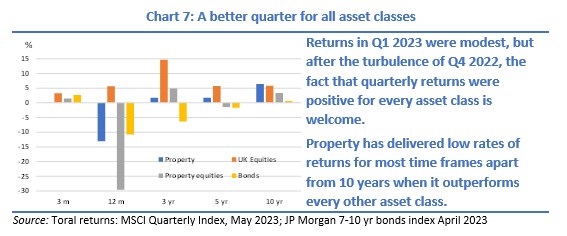
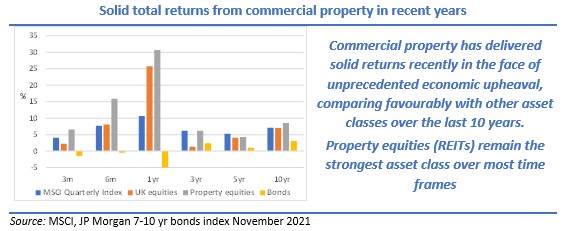
In total return terms, commercial property delivered a positive return of 1.8% in the first quarter, pushing returns over the last twelve months into positive territory at 0.9%. Commercial property rarely performs during recessions, but as we have discussed before, this recession is like no other.
As can be seen in the next chart, property returns have more than held their own against other assets over the last 10 years.

Much of the reason behind commercial property’s solid returns is down to the restricted number of developments coming on stream and the huge quantitative easing programmes which have inflated real asset prices. Property has also benefited from ultra-low interest rates ensuring that the asset class delivers high levels of income, relative to other assets.
Sector issues
Industrial
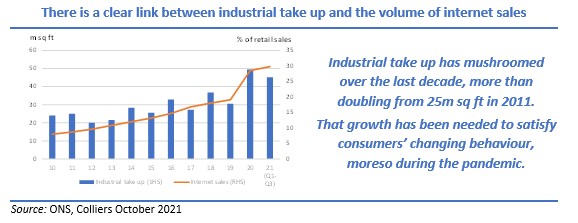
Long regarded as the third sector in terms of investment and investor interest, the recent outperformance of industrial assets and positivity surrounding the sector has well merited the reassessment it has undergone. Now the largest of the three sectors by some way – making up over 30% of the MSCI (IPD) Quarterly Index – it has certainly benefited from the pandemic-induced stay at home orders and shop closures.
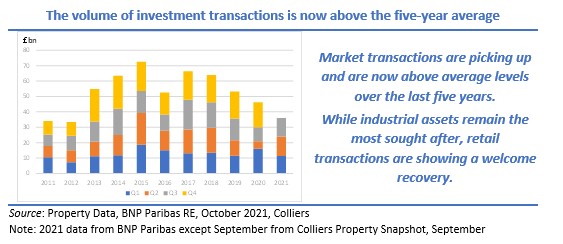
Investment transactions hit a 20-year quarterly high in Q4 amounting to £5.6bn and the start of 2021 has also started strongly with transactions of £3.2bn, the third highest quarterly total in the last 20 years. At a time when investment in commercial property is down markedly, industrial’s investment in Q1 2021 is almost double that seen in the equivalent quarter of 2020.
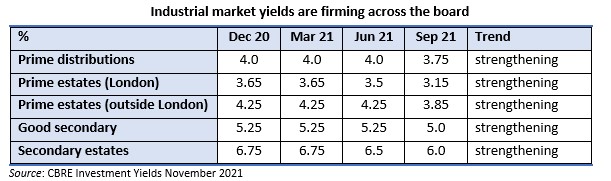
This renewed demand for safe, solid income has pushed prime industrial yields down by 50 bps over the last twelve months, to 3.75%, remarkably half that of many prime retail assets. Pressure remains for further hardening of these prime industrial yields in the short term.
Offices
The key question critical to the future performance of offices is how the future use of offices will pan out. The work from home requirement has been more successful in terms of productivity than could have been imagined, but now, more than a year after the first lockdown, there are signs of workers suffering from ‘Zoom fatigue’, and many missing the company of colleagues. Many employees enjoy the greater flexibility that working from home offers: others would prefer to return to the office as their home has not proved suitable.
Many virtual board meetings will have discussed future working arrangements. There is, though, no unanimity in their deliberations. Two of the largest financial services companies, Goldman Sachs and JP Morgan have recently announced their future plans, and ensuring debate continues, they are taking different stances. On one side, Goldman has told staff to be prepared to return to the office in June. It also plans to open a new technology hub in Birmingham later this year. On the other side, JP Morgan has announced it intends to use “significantly” less office space in the future, requiring only 60 seats per 100 workers.
Irrespective of whether the Goldman or Morgan approach is the one favoured by the majority of businesses, what is clear is that work will definitely not revert back to the pre-Covid model. Surveys from several organisations have pointed to a desire by employees to a return to the office, but for just two or three days a week.
From an investment point of view, it is clear that investors will need to engage with tenants, and potential future tenants, in a way not required before. Flexibility will be the buzzword, landlords offering space that is flexible in terms of floorspace design, can be configured with all the necessary safety features, and even with greater flexibility in terms of lease length. Inserting more break clauses may not be what investors want but they may become a necessary feature for ensuring the space is let.
Retail
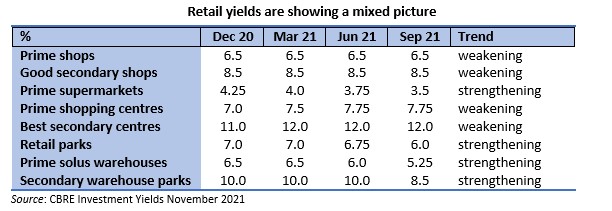
The performance of retail assets, on the whole, continues to disappoint. There are clearly a few bright spots, such as supermarkets and some supermarket-anchored retail parks, but for the majority of shops and shopping centres, valuations remain under downward pressure. A further 7.9% fall in average shopping centre valuations in Q1 brought the cumulative average fall over the last four years to 53%. Investors have been reluctant to trade in this market – the few deals that have occurred recently have focussed on the potential for change of use – but there are signs that deal flow may be on the up and with a deepening pool of investors. A test of the market will be potential sale of the Touchwood Shopping Centre in Solihull which is being marketed for £130m, an initial yield of 7.5%. A few years ago, its valuation was more than £400m.
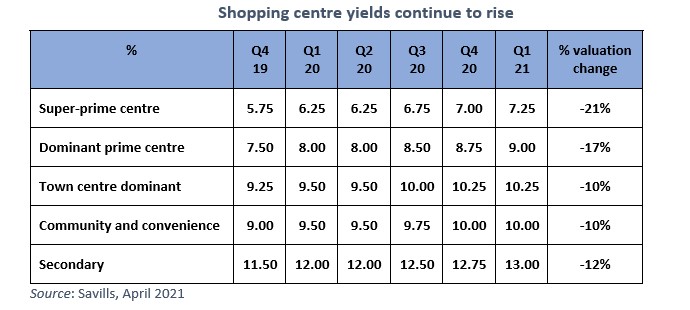
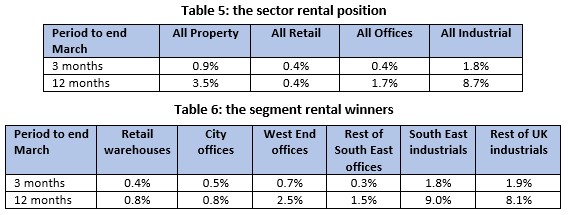
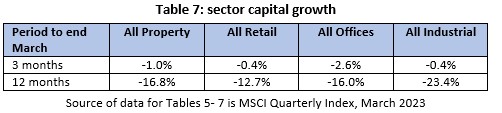
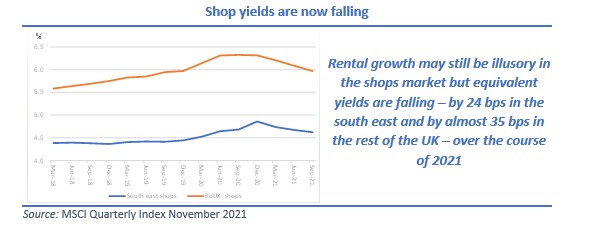
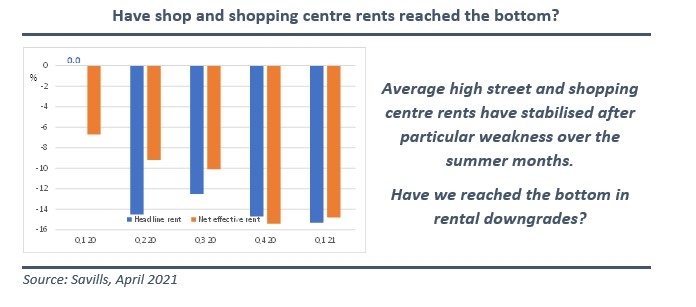
The above valuation change calculations show only the impact of rising yields and take no account of movements in underlying rents. Factoring them in as well gives a more sobering assessment of the performance of many retail assets. However, the table below does indicate that the rate of decline in both headline and net effective rents seems to be levelling off after collapsing last summer.
Do rising bond yields point to rising property yields?
We now ponder whether property’s fortunes are about to take a hit. We mention later in the report that development completions are edging up, at a time when tenant demand remains quiet. A more fundamental concern relates to the re-emergence of inflation and the consequent increase in interest rates that would bring. While some commentators believe that inflation is a concern for only the US, yield curves around the world have been moving up in recent weeks. The equity sell-off in mid-May was a direct result of investors factoring in the return of inflation, and higher interest rates, into their portfolios.

In much the same way as the pandemic has accelerated ongoing structural changes to the economy, it has also altered the mindset of commercial property investors. Clearly, the ability to transact has been compromised during much of the last twelve months, but the pandemic has altered investors’ asset preferences. It has also impacted on investors’ ability to correctly price income, risk and obsolescence. Much of the hit to transaction volumes was down to these aspects as to the lack of stock on offer.
Changing asset thinking
The composition of the IPD Quarterly Index highlights the shift in the makeup of the index over time. Ten years ago, for example, almost half of a typical portfolio comprised retail assets, 30% were in offices and the remainder in industrials and a disparate group of ‘other’ assets such as hotels, leisure, buy-to-let residential and care homes. Fast forward five years and the transforming of the typical portfolio was underway. The most noticeable changes were a sharp reduction in retail assets, being replaced by increased allocations to industrial and ‘other’ assets. It is important to note that the move away from retail was occurring before the recent challenges to the high street manifested, and before the severe mark down of retail valuations began. Equally, the increased allocations to industrial properties preceded the major outperformance enjoyed by these assets.
Arriving at today’s typical portfolio, we see that allocations to retail properties are now barely half of what they were ten years ago, while, remarkably, the industrial asset class, historically the Cinderella of the three main sectors, is now the biggest sector in terms of valuation. That transformation was highlighted in our report three months ago when it was pointed out that the stock market listed Segro (an industrial specialist) now has a bigger market capitalisation than British Land and Land Securities (historically the largest by far) combined.
There are two different factors working on these allocation percentages. First, sales and purchases of assets out of and into the Quarterly Index and second, the relative performance of the various sectors. Clearly, the significant underperformance in valuation terms of retail assets and outperformance by industrial assets will have been a major factor in the changes to these allocation percentages. The author calculates that roughly 78% of the reduction in retail assets’ allocation can be attributed to the fall in average values, implying that 22% of the reduction has occurred because of net sales of retail asset to investors whose funds are not measured by IPD. The industrial sector allocations prove even more interesting as relative asset valuation movements explain only 61% of the sector’s increased allocation, indicating that either assets have been purchased from previous owners not measured by IPD or that investors have been developing new estates or adding to existing estates, thereby increasing their valuations.
What is certain is that investors will continue to mould their portfolios towards assets they believe will deliver the best returns. Nimble investors will seek to anticipate changes in fashion like the move into retail warehouses in the early 1980s and the more recent move into distribution and ‘last-mile’ distribution hubs. The above instances of changing sector allocations will not be the last.
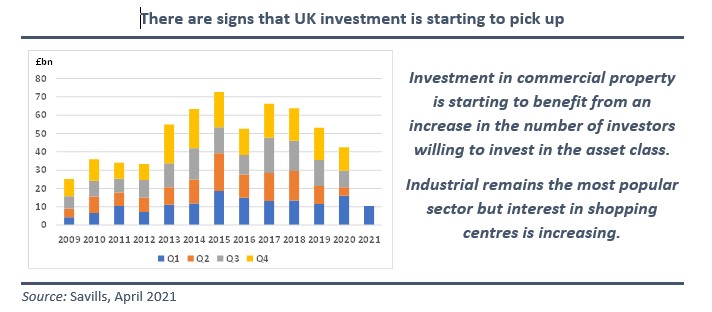
Investment in commercial property across the UK amounted to £10.5bn in Q1 2021. Although this was down substantially on the levels recorded both in the previous quarter and in Q1 2020, there are signs that investor interest is on the rise. Certainly, the number of potential investors is increasing and there are clear signs that investment in some of the recently moribund retail segments is growing.
It will come as no surprise that the industrial sector amassed most transactions in the quarter – £3.2bn – the sector’s third highest quarterly total in 20 years.
Summing up
The UK commercial property market has weathered the storm remarkably well. Few commentators a year ago would have envisaged that commercial property would deliver such a resilient performance in such challenging times.
We have long believed that commercial property would continue to deliver sound performance as long as the yield argument held up. There are signs now, though, that as inflationary pressures start to build up globally, so does the prospect of rising interest rates which may feed through to rising property yields. However, we do feel that any such increase in bond yields will be modest as central bankers have indicated that policy rates will be held at current levels for some time.
Where rising interest rates may impact the commercial property market is in altering investors’ appetite for risk. Record highs in stock markets, coupled with sharp mark downs, particularly in the US, are pointing to a reawakening by investors for more risky assets. Any change in emphasis is likely to alter investors’ assessment of the risk premium for their property assets – any upwards reassessment of the risk premium deemed appropriate could well dwarf any increase in property yields brought about by rising bond yields alone. Therein lies the risk for future performance.
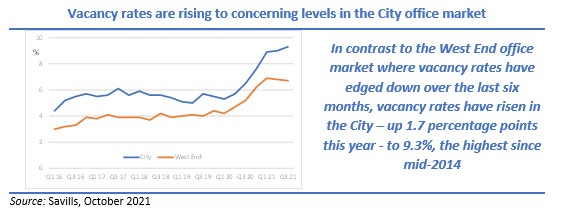
News flow will continue to influence one’s take on the future of the high street and the office, with the likelihood of a slimming down of the office stock needed in the future and further consolidation of town centre retail. Vacancy rates are increasing in the CBD office markets, although future development pipelines remain modest by historic standards.
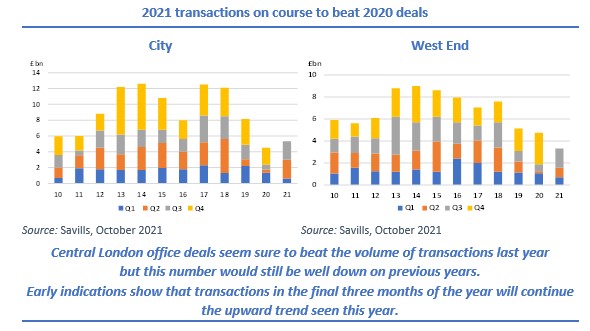
Central London offices
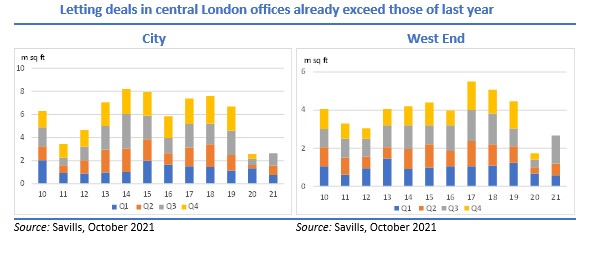
Take up of central London offices remains weak by historic standards although quarterly figures are gradually increasing from the lows of the second quarter of last year. Lettings in the City and West End combined in the first three months of the year amounted to 1.34m sq ft, down 34% from Q1 2020 but above that of Q4 when take up totalled 747,000 sq ft. At least lettings in Q1 are moving in the right direction, with March take up above those of January and February.
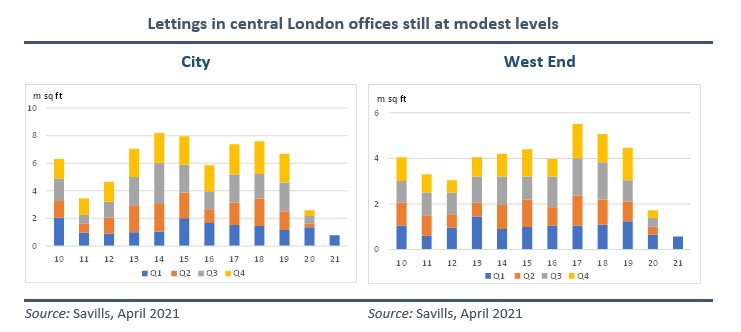
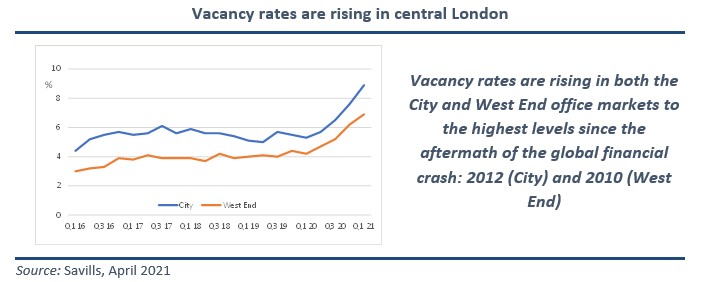
Of increasing concern to office watchers, however, is the build-up of empty office space. With limited levels of take up, completions of new developments and space being released by tenants on to the market, vacancy rates in central London are hitting levels not seen for more than a decade. There is approximately 12.3m sq ft of vacant space in the City, equating to a vacancy rate of 8.9%. Over 60% of that is in the City core where the vacancy rate is over 11%. The West End is faring marginally better – its 7.8m sq ft of empty space equating to a vacancy rate of 6.9%. One saving grace is that the majority of this empty space is of Grade A quality.
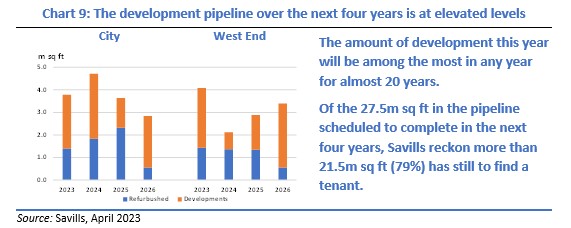
Over the course of the next 3½ years (to the end of 2024), approximately 16.6m sq ft of new development and refurbishment is due to be completed in the City. In the West End, the equivalent figure is 12.6m sq ft. Of that total, 21% has been pre-let, implying that over 23m sq ft is being developed speculatively. While that may seem high in current markets, a return to more ‘normal’ letting markets would soon soak up this new space: average yearly take up in the City and West End office markets has exceeded 10m sq ft over the last decade. However, the scale of developments alone does not tell the full story about the extent of vacant space and its likely path in the coming months and years. Much will rest on how much space tenants feel compelled to place on the market as they themselves opt to downsize their office requirements.
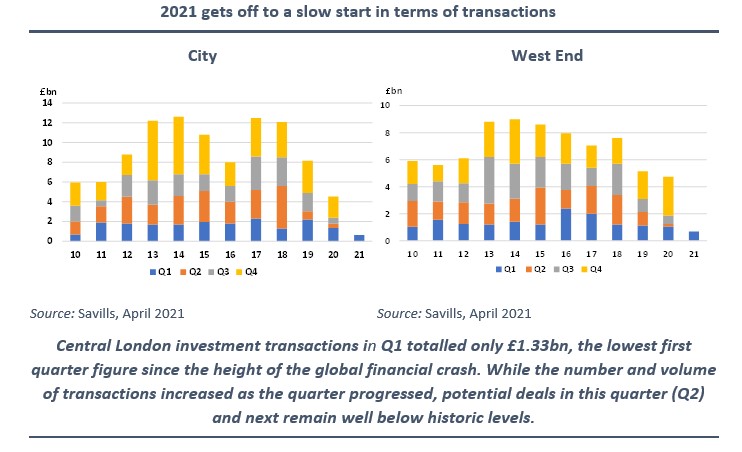
Investor interest in central London offices remains firm but restrictions on viewings and the limited stock being put on the market are curtailing the actual number of transactions. Total deals in the two sub markets in Q1 amounted to £1.33bn, just over half of that transacted in the equivalent quarter twelve months previously. At least the latest quarterly deals exceeded the low points of the second and third quarters of last year. However, by way of comparison, in investment terms, Q1 2021 marked the lowest first quarter in term of transactions since 2009.
The lack of stock being offered to the market was highlighted by the fact that only one of the twelve properties sold in the City during Q1 was first marketed in that quarter.
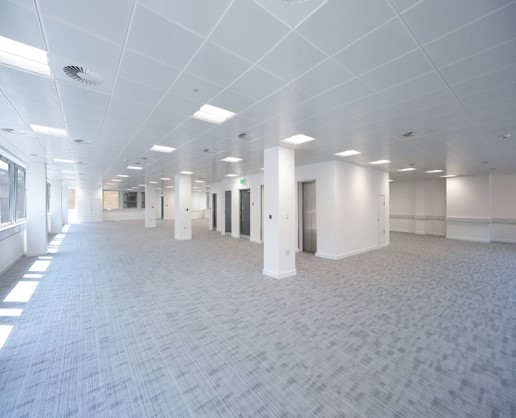
The future of the office has already been aired in the previous section but a transaction in the West End indicates that one investor has opted to convert unused office space into 42 residential units plus ground floor retail. Bain Capital, the US investor, bought Grosvenor Gardens House in Belgravia for £80m, reputably £10m above the guide price in a competitive bid.
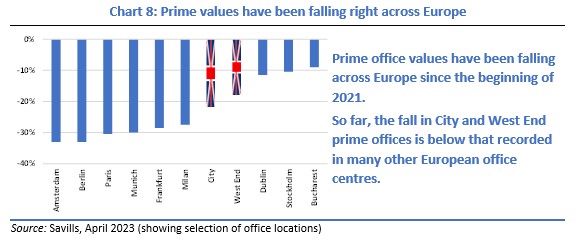
Capital values are still under downward pressure, but by less than fundamentals would have suggested. Despite a weak lettings market and modest levels of investor demand, average City office values fell by just 0.2% in Q1 for a twelve month fall of 2.2%. City offices though outperformed their neighbours as West End offices declined on average by 0.3% in the quarter for an annual fall of 6.6%. Last year marked the fourth successive year that average City office values outperformed their West End neighbours, a trend that has extended into 2021. Given the West End’s lower vacancy rate, lower number of developments coming on stream and the traditionally wider occupier base, that is an anomaly that could be soon reversed.
Summing up.
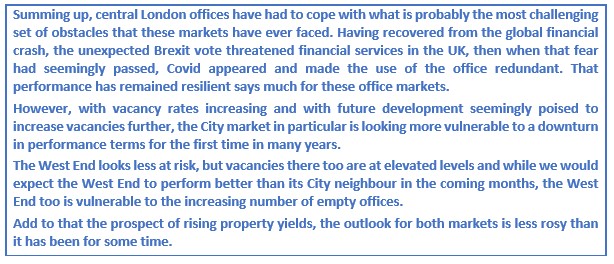
London office watchers will have been pleased, and no doubt a little relieved that the performance of both City and West End offices has held up so well, so far. Not only did these segments have to contend with Brexit uncertainties, they were faced with further economic uncertainty in the form of the pandemic.
Perhaps the first twelve months will prove to be the easiest period. Perhaps rising vacancy levels, the prospect of a large downward assessments of some occupiers’ requirements and the possible rising property yields will be the story of 2021 and beyond? Perhaps ….
Nonetheless, we still believe that it is premature to signal the end of the office as we know it. The debate over the future use and size of the office will continue for some time. For every major employer signalling the demise of the office, there will no doubt be similar numbers voicing their benefits. What is clear, though, is that the future office will have to offer flexibility and to that end, landlords will have to engage with their tenants (and potential future tenants) in ways not envisaged before.
Sentiment will continue to feature heavily on central London offices. Home to many of Britain’s biggest and high-profile employers, they will continue to generate and dominate press headlines.
Values have been declining for several quarters and only an optimist would suggest a rapid change in direction. With rising vacancy rates, rents will remain under downward pressure for some time, but we repeat that we do see a major hit to valuations in the coming months. Longer term, there is concern that rising bond yields could spill over to push up property yields but more of a worry, in our belief, are changes to the risk premium that investors will require for investing in bricks and mortar.
All investment and take up data and statistics from Savills, unless stated; all performance statistics from MSCI; all graphs by the author.
Stewart Cowe, May 2021