

Brexit news
June saw the signing of a trade deal with Australia, removing all tariffs on all goods, the first major trade deal negotiated from scratch by the government since leaving the EU. Last year, trade between the two countries amounted to £13.9bn and this figure is likely to increase following the agreement.
The Secretary of State, Liz Truss, claims that the agreement paves the way for the UK to apply to join the Trans Pacific Partnership, the 11 nation, £9 trillion free trade area which is home to some of the biggest consumer markets of today and tomorrow.
Predictably, the complex situation of Northern Ireland shows no sign of being resolved. The Northern Ireland protocol, signed by both the UK and the EU as part of the withdrawal agreement, prevents a hard border in the island of Ireland by keeping Northern Ireland in the EU single market for goods. Difficulties have arisen in transporting goods across the Irish Sea in terms of both bureaucracy and in raising prices, while the Unionists are concerned that the protocol undermines Northern Ireland’s place in Great Britain.
The House of Lords has ruled that both the UK and EU have taken a ‘fundamentally flawed’ approach to the protocol and that both sides need to compromise. Easily said, but whenever Northern Ireland is concerned, not so easy to do in practice.
In addition, there is also disagreement over the so-called ‘divorce bill’ – the amount the UK has to pay the EU for spending commitments made before the UK left the bloc. New figures from the EU puts the total at £40.8bn, significantly above the UK’s assertion of between £35bn and £39bn. The government insists that the EU has ignored money owed back to the UK.
No doubt these disagreements will rumble on. Where would we be without a little bit of tension between the parties!
Global economy
Eight months into the vaccination programmes, countries’ economic prospects are diverging further, depending on access to vaccines. On the optimistic side, developed countries can anticipate further normalisation later this year while those less able to obtain the vaccine access are still facing resurgent infections and still rising death tolls. Even those countries in this latter group where infections are currently low, are not assured of a quick recovery as long as the virus is circulating elsewhere.
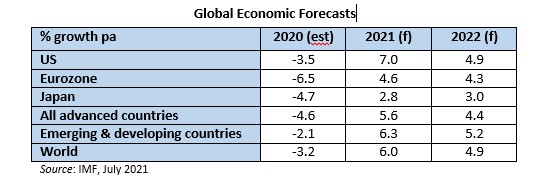
The global economy is now forecast to grow 6.0% this year, unchanged over the last three months, masking a 50-basis point increase in the growth of the advanced economies and a 40 bp reduction in developing economies. Next year sees a 50 bp increase to the global growth forecast to 4.9%. This time, both advanced and developing economies have been upgraded, by 50 bps and 20 bps respectively, from our forecasts three months ago.
The advanced economies have been boosted by continued policy support and the expectation of additional fiscal support in the US later this year. Greater optimism from health metrics is also a factor in the upgrades.
Nevertheless, risks to these global forecasts remain tilted to the downside. The clearest danger is slower than anticipated roll out of the vaccine, particularly to developing markets. But there is an obvious risk that financial conditions, which have remained accommodative throughout the pandemic, may be reassessed, especially if inflation expectations increase further. That is a point we delve into at greater length in the next section. The twin hits of limited vaccinations and higher interest rates brought about by a tightening of monetary policy would be particularly bad news for both emerging markets and developing economies.
First quarter 2021 GDP outturns surprised on the upside, particularly in Asia and Latin America. Conversely, renewed lockdowns, from which countries are just now emerging, have hit European economies. However, data for Q2 has shown that the recovery, which began in manufacturing, is now widening into service sectors. Recovery, though, has been and still is being hampered by component and labour shortages and disruption to the supply chain, all of which are affecting the speed of the bounce bank and rates of inflation.
Flash estimates of activity in Q2 remain mixed. Annualised growth of the US economy fell short of consensus growth of 8.5%, recording 6.5%, while the eurozone posted quarterly growth of 2.0, ahead of some expectations. Japan has yet to publish its Q2 estimate but expectations are for growth of 0.2%, thereby halting the run of negative quarters of growth. Disappointing consumer spending figures continue to hold back the Japanese economy. While both the US and EU are seeing accelerating growth across many sectors, the rising number of patients infected with the ‘Delta’ variant is clearly reminding everyone that we are not out of the woods yet.
Inflation
Concern has risen globally about the sharp rise in inflation and whether that will affect interest rates and through them, property yields. Inflation does tend to increase as economies start pulling out of recession and this time is no different, inflation having picked up in many economies. The reasons for this rise are both the cyclical recovery phase in which economies find themselves and the sharp reversal out of recession that we are experiencing.
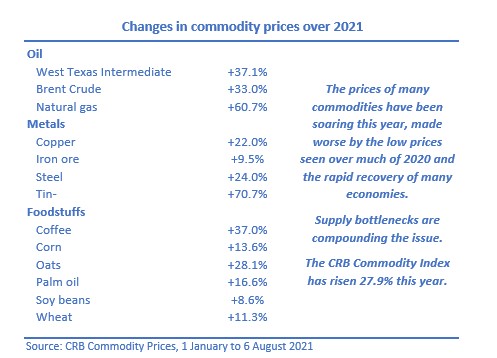
In most recession/recovery phases, time frames can usually be measured in years: this time one of, if not, the severest downturn followed by a sharp recovery can be measured in just a few months. Supply bottlenecks have been adding to pricing concerns, while, arithmetically, commodity prices were at rock bottom twelve months ago, meaning that annual rates of price increases are abnormally high. The table below shows the price increases of selected commodities this year.
There are two key questions regarding inflation. The first is, is the rise temporary, implying that rates will quickly revert to more ‘normal’ levels? The second is, will central banks take action to prevent higher rates of inflation in the future by tightening policy before the economic recovery has fully taken root. That will invariably result in higher interest rates
We believe that inflation is in most cases likely to subside to pre-pandemic target levels next year and that central banks are unlikely to raise interest rates in the short term. Our view therefore remains that interest rates will remain low for some time yet. It could, however, be more persistent if people and businesses come to expect higher inflation and seek to raise prices and wages in anticipation. That has been recently illustrated by some supermarket chains in the UK who are offering a sizeable joining bonus to lorry drivers, who are in short supply.
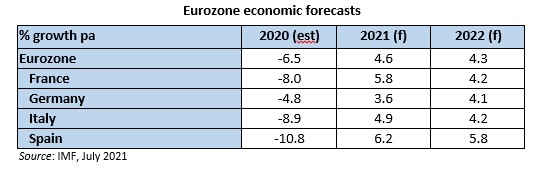
The EU economy
As activity begins to return to some sort of normality, EU unemployment is falling The rate of unemployment fell from 7.4% in March to 7.1% in June, but it still means that 14.9 million people are out of work. A year ago, the rate of unemployment was 7.6%.
Our economic forecasts have been increased for both this year and next by 20 bps and 50 bps respectively. As with our forecasts for the other economies, the risks are skewed to the downside and are vulnerable to a renewed spread of the virus.
The UK economy
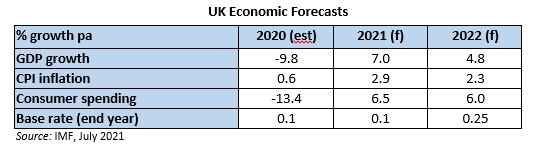
With many Covid restrictions being unwound across the UK, expectations are for the economy to deliver strong rates of growth this year. GDP for Q1 fell by 1.6%, but the economy has been on recovery mode since the end of January. The first estimate of growth in Q2 came in at 4.8%, slightly below some forecasts but we still believe that the UK is on track for a full year growth forecast of 7% (Source: IMF), an upgrade of 1.7 percentage points since our last report three months ago. Some forecasters are putting even stronger growth this year at nearer 8%, but even so, growth of 7% would be the highest yearly growth since the Second World War.
Our forecast for next year, 4.5%, is also below some forecasts, but trying to place precise estimates for events months in the future is fraught with difficulty particularly when we cannot rule out new or more virulent strains of the coronavirus affecting life for months to come.
Some caution is required before these forecasts are met:
- Covid case numbers in the UK are still running at elevated levels and though, thanks to the successful vaccination programme, the direct link between case numbers and hospitalisations seems to have weakened, we cannot dismiss the possibility that the ‘Delta’ variant or some new strain emerges to stall economic activity.
- The furlough scheme is winding down. It has been a resounding success in preventing major job losses over the last 17 months. It is telling that the unemployment rate, which many economists at the onset of the pandemic expected to rise towards 9%, is now likely to have peaked at 5.2%, an increase of just 1.3 percentage points from pre-pandemic times. However, some further job losses are anticipated from those now coming off furlough.
- The ‘pingdemic’ effect whereby workers are required to self-isolate when they are identified as a close contact of someone infected. The number of persons required to self-isolate has been modified downwards, so hopefully, future such cases will lessen any hit to output.
- Skills shortages. The economy has changed over the last 17 months, in some industries, out of all recognition. Clear winners have been food stores and online retailers. Losers include some high street retailers with no online presence and some hospitality ventures, some of which will struggle to survive even with lockdown restrictions being removed. This change in the structure of the economy is ongoing but is creating some pressure points. For example, shortages of lorry drivers have been highlighted by some supermarket chains but finding and training new staff is one thing; obtaining driving tests for these drivers is another with major delays in that process.
- Supply chain bottlenecks are affecting all countries and many industries. We highlight one aspect that has directly impacted the commercial property landscape – the move from a ‘just in time’ stock control system to a ‘just in case’ one. It will be interesting to follow this in the future to see if the latter endures.
As well as unemployment starting to decline, job vacancies are back above levels pre-pandemic. The latest vacancies covering the three months April to June 2021 amount to 862,000, 10% above the last three-month period before the onset of the restrictions. These labour shortages are contributing to some increased wage pressure with average basic pay having risen by 6.2% in Q2. However, much of this apparent strong figure is due to temporary factors such as a fall in the proportion of lower paid employees. ONS believe that the underlying average pay growth after adjusting for the reduction in lower paid jobs is likely to be around 2.5% – 3%. This lower figure for underlying wage growth is one of the factors behind the Bank of England’s relatively benign view of the current rate of inflation.
The ongoing vaccination programming coupled with the relaxation of many of the restrictions has pushed consumer confidence back to a pandemic high. Confidence numbers declined to levels last seen in 2007 at the onset of the first Covid lockdown in March 2020 but since the turn of 2021, they have been on an upward trend. The latest, July, figure is now higher than it was immediately before the coronavirus took hold of the economy last March.
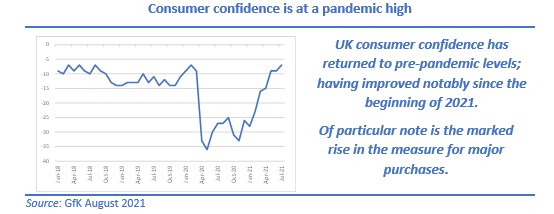
A separate survey by You Gov highlighted that the outlook for job security and confidence among households about their personal finances are both at record high levels.
That said, headline wage growth is picking up and coupled with pent up demand from both businesses and consumers, inflationary pressures are rising. Add in shortages of some raw materials and supply chain bottlenecks, inflation is on the increase. CPI inflation for the month of June measured 0.5%, the strongest monthly increase in June since records began, leading to the rate for the year to June increasing to 2.5%. The rate will increase further over the coming months to over 3% and it is likely to remain above the Bank of England’s 2% target this year and for most of next year.
From commercial property’s point of view, construction costs increased by over 10% for the year to May. Not only have raw materials been in short supply, so have workers as the industry struggles with record levels of construction activity. These cost pressures will certainly be affecting development opportunities in the commercial market with new distribution warehouses being the most at risk of being delayed, or cancelled altogether, at present.
The labour market is continuing to recover in line with the momentum behind the economic recovery. Further Covid shocks aside, the UK is poised to post the highest 2021 GDP growth rate of the G7 group of countries. Laudable as that may be, one must not lose sight of the fact that the UK posted the worst decline in activity of these countries last year.
As Covid-induced restrictions unwind, some businesses will feel the full brunt of the ending of the moratorium on eviction while the ending of business rates support may hamper some retail and leisure entities.
Market Commentary
Not only has the commercial property market been moving at different speeds, it has also been going in different directions – the gung-ho industrial market, the resilient performance of offices and the valuation collapse of many retail assets. Growth in asset values in the industrial market alone has propelled the market as a whole into positive territory for the last two quarters. Leaving the high-flying industrial sector to the side, the performance of the rest of the market has been less satisfactory, but more in line with returns expected during the more challenging recessionary influences that we have encountered.
There was a welcome return to growth in retail assets in Q2, growth in average shops and retail warehouses offsetting the continuing collapse of shopping centre valuations. This return to average asset value growth of retails ensured that all three main sectors posted positive growth in the quarter for the first time since the last quarter of 2018.
Growth in average property values, as measured by the MSCI Quarterly Index, came in at 2.3% for Q2, nicely building on the return to growth seen in Q1. But this return to growth has been flattered by the performance of the industrial sector, which in Q2 delivered average growth in values of 6.4%, the highest quarterly figure since the MSCI Quarterly Property Index was launched in 2001.
At least the cataclysmic fall in retail values has ended with Q2 growth of 0.3%, although that masks a diverging profile with retail warehouses seeing 2.0% growth in the quarter but shopping centres continuing its downward trajectory with a further fall in average valuations of 2.7%. The move by retail assets as a whole into positive territory ended a run of ten quarters of declining capital values.
The performance of offices during the pandemic has held up remarkably well, capital value movements being midway between the soaring industrials and plunging retails. There is little consensus as to how the office will work in the future. It certainly will not be the same; but we do not subscribe to the theory that the office is dead with everyone working from home. Neither do we expect offices to return to pre-pandemic levels of occupancy. Yes, some firms will take one or the other of these extremes but the large majority will favour a ‘blended’ approach, workers mixing working from home and working in the office, with office capacity reduced.
From a performance point of view, there has never been such a wide spectrum of returns. In the five quarters since the onset of the pandemic (the beginning of Q2 2020), total returns from a basket of retail assets were -6.7%, a basket of office assets, 0.1% while industrials would have delivered an astonishing 22.6%. If one’s fund performance is measured and ranked by MSCI, sector allocation has never been more crucial.
So critical, that a fund with the foresight of not having any retail assets and whose sector allocation otherwise followed the MSCI Quarterly Index’s sector weights would have delivered a total return 6.25 percentage points more than the official All Property total return over these five quarters (10.6% v 4.35%) and four percentage points per annum more over the last five years (8.3% pa v 4.3% pa) (both author’s calculations).
Commercial property yields are currently showing no signs of following gilt yields higher. MSCI report continuing yield hardening in sectors over Q2 (when yield compression was the greatest contributor to capital growth for the market as a whole) while Savills report that prime yields have remained, on the whole, static over the quarter with West End offices falling another 25 basis points to 3.25%, a level last seen almost three years ago.
It is easy to see why the industrial market has been the clear winner in terms of performance recently. For investors, industrial, until recently, was regarded purely as an income play, its high yield compensating for minimal, if any, rental growth. How that has changed over the last year or so. Strong demand from investors has pushed average yields down to historic lows (and to levels considered unlikely just a few years ago). At the end of Q2, average (equivalent) yields of industrial assets in the MSCI Quarterly Index stood at 4.4% – the lowest of the three main sectors. Prime industrial yields, according to Savills, now stand at 3.5% – a year ago they were a full point higher.
Investors remain optimistic over the prospects for industrial assets. Take up is running at unprecedentedly high levels, vacancy rates are at historic lows while the development pipeline is struggling to keep pace with tenant demand. Online distribution facilities have mushroomed during the pandemic and ongoing disruption to global supply chains (not eased by Brexit issues) are forcing businesses to hold more stock than was thought necessary before – in effect changing the business model from ‘just in time’ to ‘just in case’.
Industrial space take up is running at its fastest pace ever, over 24m sq ft in the last six months, and over 50m sq ft in the last twelve months, both records by a long way. The bulk of recent transactions are from online retailers but manufacturers too are acquiring more units, its share of the warehouse take up doubling to 15% in the space of one year.
Investment volumes for the market as a whole are picking up. Deals worth £12.59bn in Q2 (source: Property Data and BNP Paribas RE) was the highest second quarter for three years. Likewise, the total for the first six months of the year was the highest since 2018. And though this half year total is comparable to the ten-year average, it is a pale shadow of the volume of transactions during the middle of the last decade. Indeed, the £23.95bn total transacted over H1 was just 60% of that in 2015 at the height of the market.
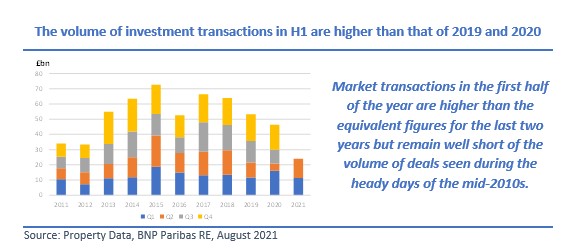
However, the source of capital for these transactions has been shifting over the decade. UK investors are still the largest single grouping by a long way, but their share of total UK transactions has fallen from 64% in 2011 to 48% last year while the domestic share during the first six months of 2021 has shrunk even further to 44%.
It is worthy of note that overseas investors do not seem to have been put off investing in the UK since the Brexit vote in 2016. Their share of total transactions has continued to rise despite the grave warnings that some economists made at the time of the referendum about the viability of UK business after it leaves the EU. Indeed, the year after the vote, 2017, saw the highest annual amount of UK property bought by overseas investors (£32.5bn out of that year’s total of £66.5bn). It’s wonderful what a sharp deterioration in the sterling exchange rate does to the mindset of overseas investors!
The sustained investors demand has ensured that total returns from commercial property remain highly competitive against other domestic asset classes. Indeed, over the last decade, commercial property has delivered higher returns than those of UK equities and government bonds. Also note the recent strong performance of REITs which is often a leading indicator of the performance of direct property.

Some commentators are suggesting that, in an era of higher inflation, commercial property is well placed as an inflation hedge. We do not fully subscribe to that view. The rental growth outlook remains particularly weak for retail and office assets, with only industrial assets generating meaningful rental growth over the short term.
Rather, we believe that property performance will be yield driven; capital growth and through that, total returns being dependent on property yields remaining firm and, in some cases, hardening further. The outlook for the industrial sector remains positive – tenants chasing a decreasing number of available units – at least for the next few quarters.
Development is increasing, but so are costs. Bar for some completing in the coming few months, these cost increases, and in some cases lack of available construction staff and materials may begin to impact negatively on proposed new builds. Some proposed development may become unviable or may have to be deferred thereby further limiting tenant choice and further pushing up asking rents.
The industrial sector
Rarely can a set of drivers have been lined up so perfectly for any part of the commercial property market than for the industrial sector just now: the enforced closure of much of the physical retail space, the necessity of shoppers to buy online and the corresponding massive demand from distributors that has fuelled the growth in rents. Through that, demand from investors has driven yields down to historic low levels. Yet, the industrial sector has for many years delivered above market average returns, generated mostly from the high income return, which compensated for limited rental growth … until now.
Average asset value growth over the last 12 months in excess of 20% in many regions of the UK has propelled this previously unfashionable sector to the top of investors’ must haves. Take up of distribution space is currently running at unprecedented levels with over 21m sq ft let in the first six months of 2021, reaching levels that have become customary for the whole year.
Not surprisingly, the amount of available space has decreased markedly. At a nationwide level, the vacancy rate has dropped to 4.8%, the lowest since records began (source: Savills). Grade A space only accounts for just over a quarter of this amount. Speculative development is picking up, but the estimated 17m sq ft underway is equivalent to only five months take up at the current pace of letting.
The retail sector
While the immediate outlook for rents and yields remains the weakest of the three main sectors, there are glimmers of optimism on the horizon. The collapse in values across the retail space seen over the last few years seems to have come to an end. Rents and values are still falling in high street shops and shopping centres, but at a much lesser pace. But retail yields are firming – the 6 bp fall for average shops and shopping centres being the first quarterly fall in equivalent yields for three years. Add to that the ending of most restrictions so giving a welcome boost to spending on the high street and other physical shops.
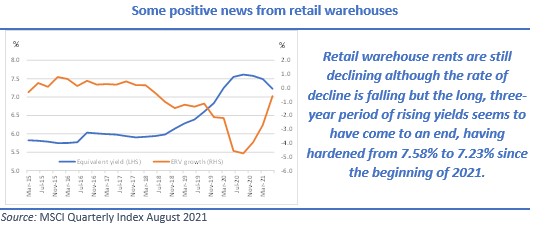
One bright spot is the return to favour of retail warehouses. Average rents may still be falling (by just 0.6% in Q2) but yields have now been moving in for two quarters, finally reversing the three-year rise.
The office sector
The office sector is one that has bypassed much debate over the last year or so, not because there has been little of note to discuss – far from it – but more because of the headlines raised by the soar-away industrial values and the depression that has been felt in the retail sector. Minimal capital movements and mid-range total returns, nevertheless, are commendable during the deepest recession in history and also because many offices have been unused for over a year. The position in central London is covered in some detail in the next section, but here we concentrate on the office markets outside central London, using the MSCI regional definitions.
The drivers of property performance differ across the regions – occupier demand differs everywhere and so too does the quality of existing stock and provision of new stock. Consequently, vacancy rates vary by region, and can move erratically when developments complete and become let. The following charts show the outlying regions in terms of current vacancy levels – both those where vacancies are high and where they are below average.
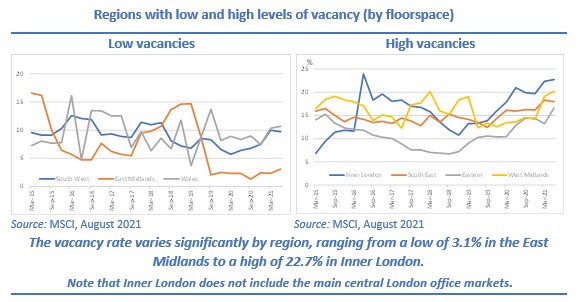
Unsurprisingly, there is a link between vacancy levels and rental growth. The regions on the left hand chart showing low vacancy rates have recorded positive rental growth over the last year, in contrast to many of those with higher vacancy levels. However, West Midlands, which currently has a vacancy
rate of 20% has recorded the highest rate of rental growth over the last twelve months (2.3%).
| Summing up, were it not for the industrial sector, commercial property would have delivered disappointing rates of return, but more in line with what is expected during a recession. The pandemic and the resultant changing shopping habits it created has merely accelerated what has been ongoing for several years.
The outlook for industrial assets looks set fair for some more quarters with still high levels of tenant and investor demand. But the sector is in an unusual situation with ultra-low yields and so remains vulnerable to interest rate shocks and changing investor sentiment. Offices look fairly priced, but much will depend on how quickly businesses decide on their staffing policies and how the business is run. Meanwhile, vacancy rates are edging higher with development adding to the uncertainty. Our one change in view is to suggest that the retail sector is coming back in vogue. With most restrictions now lifted, the high street is now better placed after years of underperformance. Retail warehouses have already seen yields begin to harden, and though rental growth across the retail sector may be some way off, the sector is beginning to offer a yield/income play. |
Central London offices
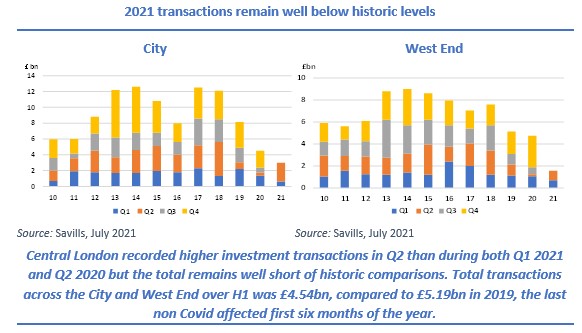
Both take up and investment transactions have improved markedly since the pandemic caused the effective closure of the market a year past March, but even so, both measures are still off their pre-pandemic highs.
In terms of investment transactions, Q2 deals in the City and West End combined amounted to £3.2bn. This compares with deals of only £590m in the equivalent quarter last year, at the height of the pandemic-induced market closure. This improvement helped both central London office markets to post deals in the first six months of the year well up from that of last year – in the City a rise of 64% and an increase of 25% in the West End.
So far this year, there has been a welcome return of large transactions, i.e. transactions over £100m. In June alone, two transactions totalling almost £1bn completed: the 550,000 sq ft, 18-storey, multi-let 30 Fenchurch Street office building was purchased by Brookfield, the North American investment manager for £635m while the near 300,000 sq ft Minster Building in Minster Court was bought by Far Eastern investors for £353m. Both deals reflected net initial yields of 4.5%. The largest West End transaction in Q2 was the £177m purchase of One Embassy Gardens, SW8, by the Beverly Hills based real estate investment company, again at a net initial yield of 4.5%. These transactions demonstrate that Covid or no Covid, the large deals are back.
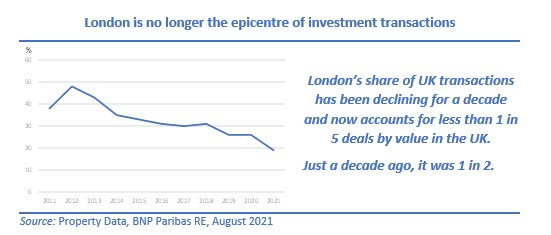
However, looking at investment strategies, investors are no longer favouring investment into the London-centric markets as much as previously. The percentage of the total market that is being accounted for by central London office deals has been on a declining trend for over a decade. Clearly, investors have been moving into industrial markets recently, to the detriment of other sectors, but it is striking that the share of the market that central London offices account for has shrunk by more than a half over the last decade.
Uncertainty over the future use of the office is another factor causing investors to look elsewhere. But with the latest IPF Consensus forecasts indicating that investors expect the office sector to start outperforming industrials from 2023, and retail assets from the following year, central London’s share could once again edge back up.
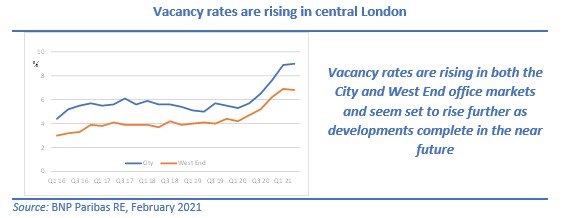
As to be expected in times of below trend lettings, vacancy rates are moving higher. The City’s void rate is now 9.0%, a 10 bp rise in the quarter and 330 bps higher than at June 2020. That vacancy rate is sure to continue rising in the short term with nearly 500,000 sq ft being added later this year on development completions and the release of 290,000 sq ft in the St Botolph building in EC3 by its present tenant, the insurer JLT. The West End is faring slightly better. Its present vacancy rate of 6.8% is 10 bps lower than three months ago but it is still at elevated levels compared to the recent past.
Presently, there are 27m sq ft of developments due to complete in central London by the end of 2024. Of that, just 21% has been pre-let, signifying that there is 21m sq ft of speculative space scheduled to complete in the next 3½ years. That may be an over-estimation of the picture with worker and material shortages likely to delay some completions. Increasing material costs may also cause some developers to defer some of the later projects, but even so, if alarm bells are not ringing now about vacancy levels, they soon will be.
The lettings market continues to see steady growth quarter by quarter. Take up in Q2 in both the City and West End markets was up from that in the previous quarter. The West End is seeing by far the greater interest with Q2 take up almost 10% higher than in the previous quarter, while over the first six months of the year, take up was 20% higher than in H1 2020. In contrast, take up in the City remains modest, its H1 2021 figure being down 14% on the equivalent period last year.
In contrast to investment transactions, which saw a welcome return of the large deals, the lettings market has been dominated by small transactions, particularly those below 10,000 sq ft. It is clear that the bigger employers are still playing a waiting game before deciding on the next move.
However, there are signs that the lettings market is beginning to awake from its lengthy slumber. Space under offer at the end of the quarter (June) has increased significantly from three months ago while several occupiers are reactivating their search for new premises.
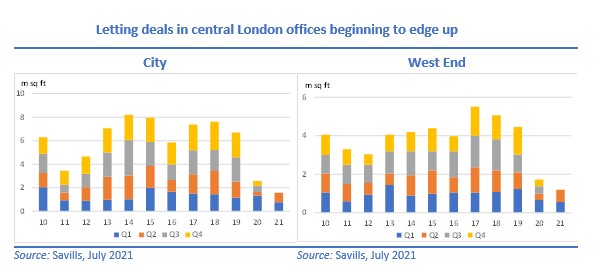
Perhaps surprisingly, average rental value growth picked up over Q2. After five quarters in which average rental values fell in both City and West End office markets fell. ERV growth turned positive in the most recent quarter, rents rising by 1.5% in the City and by 0.7% in the West End.

Yield compression rather than rental movements was the driver of capital growth in Q2. Yields in the City fell by 25 bps (from 5.53% to 5.26%) in Q2. Given that the IPD Quarterly Index covers 110 City offices with a total valuation of £4.4bn, such a large inward yield shift shows that it was not just a few, prime properties that benefited from yield hardening – it was a far larger subset where yields moved in. West End yields saw a much more modest inward yield shift of 6 bp average. West End yields are almost a full percentage point lower than those of the City in the MSCI database while, according to Savills, prime West End yields are 75 bps lower than those in the City.

| Summing up, it is remarkable just how well the central London office market has weathered the recent storms. Not only has it had to cope with the implications of the Brexit vote, it has had to endure a lengthy period in which much of the office space has effectively become redundant.
Take up and investment transactions are picking up, but remain well below recent years’ figures while vacant space is rising to worrying levels, especially in the City. On many counts, central London offices look fairly priced, as long as general interest rates remain where they are. However, it is difficult to see where rental growth is going to come from in the short term. High vacancy rates and a poor outlook for rental growth implies that central London offices are vulnerable to changes in investor sentiment and upward yield pressure. |
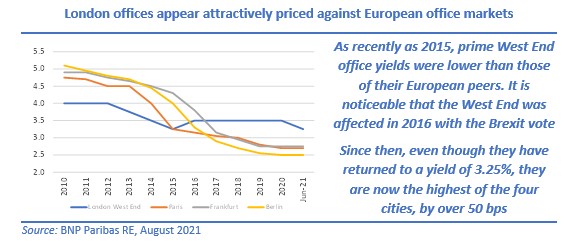
Finally, it is worth considering the wider picture. Most commercial property markets, and certainly those in western Europe, are experiencing not dissimilar features such as lower take up and curtailed development. Huge quantitative easing policies have lowered interest rates around the globe, consequently leading to low property yields and higher asset prices. Under that scenario, London offices look favourably priced against its European peers. According to BNP Paribas, prime West End yields, despite standing at a near all-time low, are now higher than those of Paris, Frankfurt and Milan. Conversely, the continental office markets are generally looking expensive.
All investment and take up data and statistics from Savills, unless stated; all performance statistics from MSCI; all graphs by the author.
Stewart Cowe, August 2021