Brexit news
Now that Brexit is a reality, it is becoming increasingly difficult to determine whether specific aspects of the economy are reacting to ‘Brexit effects’ or merely reacting to the more global effect that is coronavirus. Consequently, we have decided to retire this section after more than five years.
Any impact to the UK or other economies on what could be considered a Brexit factor in the future will certainly be included in future reports in the section to which it relates.
However, we do mention in closing the prospect of the UK-EU trade deal being threatened over the UK threatening to trigger Article 16, fundamentally rewriting the protocol on Northern Ireland. What would politicians do without disagreements?
Global economy
The pandemic continues to cast a dark shadow over global economies. Following strong growth in the middle part of 2021 when many governments successfully eased lockdown restraints and which in turn fuelled a significant recovery in economic activity, momentum has weakened over recent months.
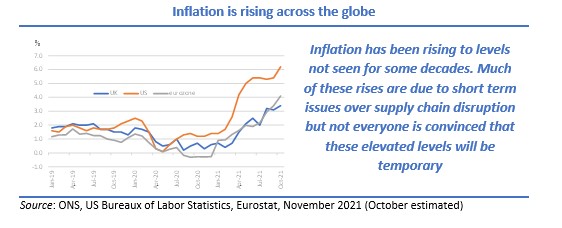
Transmission of the delta variant of the virus has not slowed down and its negative effects on global supply chains have become all too evident. Supply disruptions have increased and this in turn has led to higher inflation, reaching levels in some countries not seen in four decades.
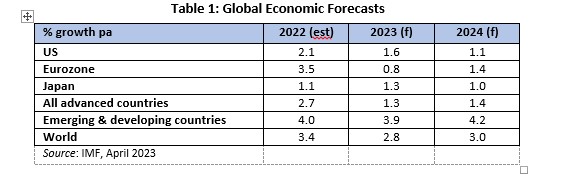
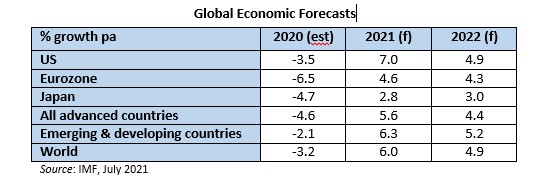
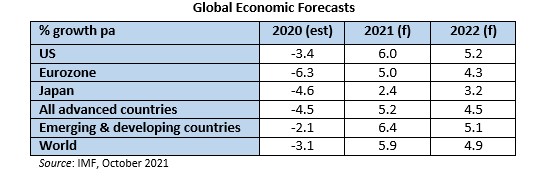
Our global growth forecast for 2021 has been trimmed by 10 basis points (bps) from our most recent (August) report to 5.9% with the next year’s forecast remaining unchanged at 4.9%. These broadly maintained high level figures mask some significant differences in country performance: large 2021 downgrades for the US (down 1.0% from our last report), Germany and Spain (0.5%) and ASEAN countries (1.4%) and large upgrades for South Africa (up 1.0% from the last report), Italy (0.9%) and France (0.5%). It is noticeable that for many of these nations, upgrades for 2021 are followed by reductions in 2022 while the opposite often occurs for those having been downgraded this year.
Not all countries are recovering to the same extent. The differing country performances are starkly shown by the fact that aggregate output for the advanced economy group is anticipated to regain its pre-pandemic trend path next year (and to exceed it in 2024 by 0.9%) whereas that for the emerging market and developing economy group (ex-China) are expected to be 5.5% below the pre-pandemic forecast in 2024.
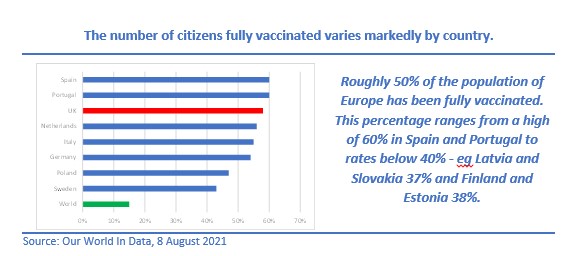
Much of this two-speed recovery can be attributed to the levels of access to vaccination: around 60% of the population of the advanced economies are fully vaccinated (and some are receiving their third, or booster, jabs), while only about 4% of the population of low-income countries have been vaccinated. The noticeable increase in Covid infections currently being seen in many countries also places doubt on the ability of countries to maintain current rates of economic growth with some countries edging towards renewed restrictions including the possibility of new lockdowns. Just when we thought that the vaccination programmes were winning the battle against Covid, we are having to accept that Covid-19 has not gone away and may be with us for some time yet.
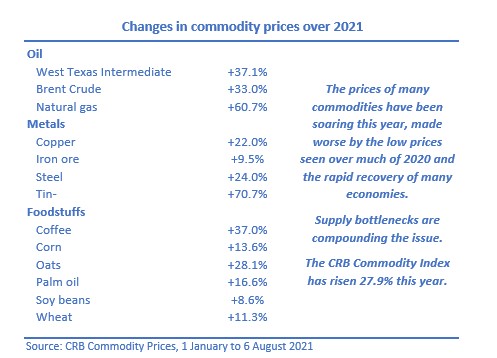
Supply disruptions are another concern to many countries. This has resulted in shortages of key materials. Coupled with pent-up consumer demand and increases in commodity prices, inflation has begun to rise particularly rapidly, giving central bankers challenges they have not faced for many years. While some central banks are playing down the length and severity of future inflation, others, including the Bank of England, fear that higher inflation may be with us for longer and that the peak in inflation may well be higher than many foresee.
After a couple of quarters of above trend growth for many countries, third quarter GDP from across the globe showed much slower growth. Supply chain bottlenecks were cited by many countries as a key reason for the slowdown, as was the impact of much higher rates of inflation. The US were first to announce their economic growth in Q3: 0.5% growth against 1.6% in Q2. The euro-area and the UK posted higher growth rates, even if both were hampered by supply chain problems.
All-in-all, risks to economic prospects have increased and are tilted to the downside.
Inflation, interest rates and commercial property
There are concerns that the great moderation, the lengthy period during which business cyclicality and inflation both reduced, has not just come to an end, but is in the process of reversing. Inflation rates are increasing right across the globe, in some cases, to levels not seen since the turbulent 1970s. Some central bankers believe that these higher rates of inflation will be short-lived: others, including the Governor of the Bank of England, are less bullish and believe that inflation will be higher for a much longer spell than most are predicting. Certainly, there are daily indications of firms raising prices and commentators widely expect UK CPI to rise further from today’s 3.1% – maybe to as much as 5% – in the coming months, which would be the highest in a decade.
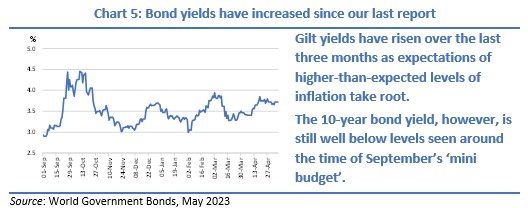
In anticipation of a rise in base rates, which the market now expects within the next three months, UK government bond (gilt) yields have been edging higher, the 10-year gross redemption yield having doubled (to 1.2%) over the last few months. A hike in the Bank’s base rate is inevitable although the market was wrongfooted earlier this month when the Bank opted to take no action at that time. Expectations are for the Bank to raise rates in early 2022. Higher costs of money and rising bond yields do affect investors’ views on all assets by making them less attractive relative to gilts. But will this (relatively) small uptick in the bond yield actually affect sentiment to commercial property?
Historically, higher inflation was often accompanied by higher rental growth. That will be much less of a feature today. Apart from parts of the industrial market, tenant demand is just not there to push rents higher: additionally, leases are typically much shorter nowadays, so that fewer tenancies actually extend past the first rent review date.
The second indirect impact higher bond yields have on commercial property is that they also tend to precede higher property yields. So, will a higher interest rate environment mean that property yields will increase as well?
The short answer is yes, but we remain relaxed on that possibility as we believe that the Bank will steer a very gradual course with the base rate still at or below 1% by the end of next year. In these circumstances, property yields should be unfazed by that small increase, certainly at the prime end, although more secondary assets or properties in less desirable locations with break clauses or lease expiries may see some upward pressure on yields. As one agent put it, “there will be a big difference between the best and the rest”.
The EU economy
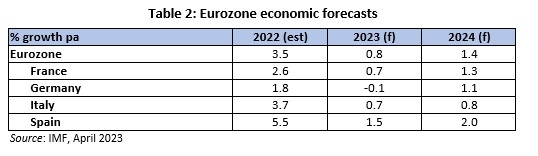
The EU moved out of recession in Q2 with growth of 2.1% following two quarters of contraction but any hopes that it would build on this positive momentum were hindered by the ongoing battles with the virus and supply chain problems which were particularly damaging to big manufacturing countries such as Germany. Even so, the first estimate of Q3 growth of 2.0% was in line with expectations.
As in previous quarters, economic growth rates differed markedly by country. Austria (with growth of 3.3% in Q3) and Portugal (2.9%) have managed to sustain above average growth rates in both the last two quarters in contrast to Germany whose fortunes have been sorely tested by the marked slowdown in global trade and which posted growth of 1.8% in Q3 after another below average growth of 1.9% in the previous quarter.
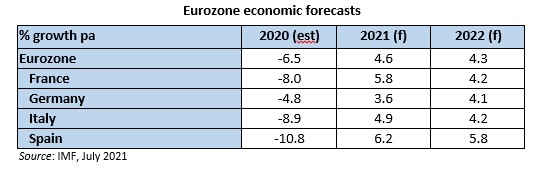
Despite these headwinds, our forecasts have increased for 2021 by 40 bps to 5.0% while next year’s expectation remains unchanged at 4.3%. France and Italy, both of which enjoyed a strong economic bounce in Q3 with growth of 4.0% and 2.6% respectively, were the main drivers of 2021’s upgrade. Supply chain issues have particularly affected Germany, lowering our 2021 forecast by 50 bps. However, these problems are anticipated to be temporary and recouped next year, resulting in the 2022 forecast being increased by the same amount.
There was better news about unemployment in September which fell for the seventh consecutive month to 6.7%. It has now fallen by 1 percentage point since it peaked last summer at 7.7% but it remains well above the position pre-pandemic when the unemployment rate was 6.3% and it will be some months yet, and only with a fair wind, before that landmark is reached.
As with our forecasts for the other economies, the risks to the euro area economy are skewed to the downside and are vulnerable to a renewed spread of the virus.

The UK economy
Rising inflation, growing unemployment, rocketing government spending and borrowing, increasing taxes, high energy prices and shortages of goods. That is all very reminiscent of the grim period of the early- to mid-1970s. For UK citizens with long enough memories, a period which culminated in the UK having to go cap-in-hand to the IMF for a £3.9bn bailout and which then ushered in the lengthy rule of Margaret Thatcher.
But these economic factors are not just back in the UK, they are also present in many other countries. The pandemic may be being tamed, although that is still debatable, but its legacy of high government debt with its repayment issues, increased unemployment, supply chain problems and high inflation is gripping much of the global economy.
Who would have believed that Germany, the model of fiscal prudence, could see annual inflation of over 4½%? Who would have considered that after decades of moderating influences for inflation, in particular globalisation, it would so quickly unwind and create inflationary pressures? And who would have contemplated the fault lines in global trade caused by major delays to supply chains?
All these aspects are in addition to the financial, social and political impacts that the pandemic continues to create, almost two years since its discovery at a Chinese ‘wet market’. Add to that the continued uncertainties surrounding the country post-Brexit, it is then clear that policymakers have a lot on their plates.
The short, sharp downward jolt to activity around the world followed by an equally rapid recovery that was promulgated in early 2020 now seems an age away. The successful roll-outs of vaccines has slowed the transmission rates, reduced the mortality rate of those infected and enabled much of the world to ‘get back to normal’ but challenges remain: virus transmission rates still remain high in many countries, forced isolation following close-contact is still prevalent while disruption to supply chains is a world-wide phenomenon, made worse by the pandemic, and not just one encountered in the UK following Brexit.
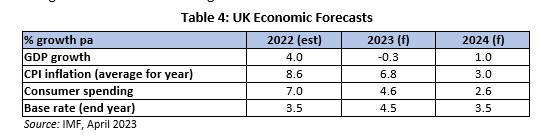
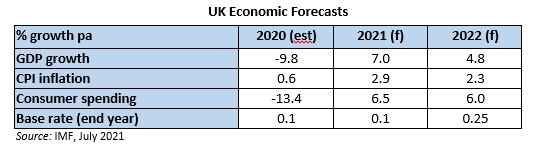
The recovery in the UK is slowing down – similar to that of many other countries – but at least activity in Q1 and Q2 has been revised up in recent statistics. The magnitude of the Q1 contraction initially announced has been reduced from 1.6% to 1.5% while growth in Q2 has been upped from 4.8% to 5.5%. However, the slowdown evident since the summer limited further recovery to growth of just 1.3% in Q3, according to first estimates. This has prompted a slight downward 20 bp revision in our expectation for 2021 to 6.8% with a compensating 20 bp upward revision to the 2022 forecast. Risks to our forecasts remain tilted to the downside. This Q3 figure indicates that the economy is still 2.1% below pre-pandemic levels (although the gap is narrower when using monthly data).
Of major interest for policymakers has been how much the economy has been ‘scarred’ by the pandemic – i.e. the damage done to the economy that is not recoverable in the future. In the November Budget, the Office of Budget Responsibility cut its scarring assumption for the UK economy from 3% to 2%. The Bank of England is even more optimistic at just 1%. Putting that into perspective, the scarring caused by the global financial crash is estimated to have resulted in a 10% permanent loss of output in the UK. The current scarring brought about by Covid crisis therefore may be seen merely as a footnote in future assessments of the economy. But that is not necessarily the view just now with the economy still struggling to regain momentum after the summer bounce and autumn slowdown.
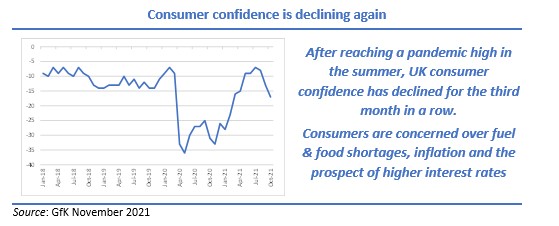
Inflation has re-emerged as a key concern. We have commented earlier on the impact that inflation is having at the global level and the UK is not alone in witnessing inflation at levels rarely seen in the last three decades. Already more than one percentage point above the Bank of England’s 2% target, commentators are suggesting that the UK’s CPI could approach 5% by spring 2022 before edging back. The Governor of the Bank has indicated that the Monetary Policy Committee (MPC) will act sooner rather than later in trying to curb future increases. But markets were spooked when rates remained at 0.1% at the November meeting of the MPC after which February 2022 became the new favoured month for the first rate rise in three and a half years. The impact on property performance of any increases in interest rates has already been discussed and is further developed in the next section.
October saw the end of furlough. It was an unqualified success, limiting the rise in unemployment which otherwise would have resulted. By the end of the Coronavirus Job Retention Scheme, there were still 1 million workers still on the government’s payroll – the question is what is the future for these workers? It has been widely reported that there are presently over a million job vacancies across all industry – but those unemployed do not necessarily have the required skills, nor are they in the right location to fill these vacancies– witness the need to encourage overseas drivers to come to the UK on temporary visas. However, given the monumental hit to the economy last year, the fact that unemployment has only risen by 50 bps since March 2020 to 4% shows the success of the furlough scheme.
But that success has come at a cost with the government now wrestling with how to finance this largesse. Already, national insurance increases have been announced, purportedly for financing the rise in the social care budget, VAT rates for hospitality are on the way back up and further tax rises will certainly be needed. As before, the government faces the dilemma of when to do so – too soon and it could choke recovery; too late risks even higher inflation. The thorny prospect of whether to again break an election pledge not to raise taxes is one more issue that the government needs to ponder.
Despite the success of the UK’s vaccination programme, Covid transmission rates remain stubbornly high. So too does the number of Covid-related deaths. Consequently, the UK has been and continues to be more vulnerable than many other countries to disruption to its activities. Although currently far from the government’s thoughts, a re-introduction of restrictions or even another lockdown cannot be ruled out.

Market Commentary
With recovering investment activity and improving levels of occupier interest and take up, Q3 was sizing up to be a particularly strong quarter in terms of performance. And so it turned out. In many ways, the 3.0% average capital growth at the all property level and the 4.1% total return was exceptional given the many and large headwinds the industry has been facing in the last few quarters. The quarter’s performance was the best in seven years and the 11th best quarter’s return in the near 21-year history of the MSCI (IPD) Quarterly Index.
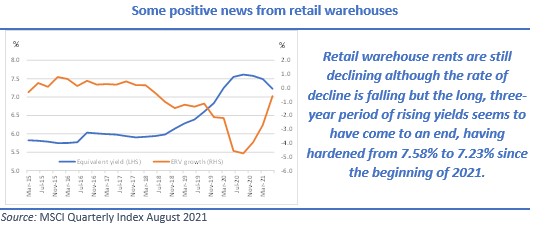
The key drivers to this strong performance were further inward yield shifts across most property segments and the continued stand-out performance of industrial assets. Even the hard-pressed retail sector as a whole posted positive capital growth in the quarter with retail warehouses seeing particularly strong growth. Average values increased there by 5.4% in the quarter, which builds on the previous quarter’s 2.0% increase.
For 2021 to date, all property total returns have totalled 9.6%. The current slowdown in the recovery of the economy would normally suggest caution on future quarterly returns but current sentiment to and momentum in the commercial property market would suggest that Q4 may also be a strong quarter, if not quite at the scale of Q3. But the immediate path of the economy is not the only headwind to future performance. Arguably of greater concern is the ever-more certainty of interest rate hikes. A slowing economy coupled with rises in the cost of money is rarely good news for property investors.
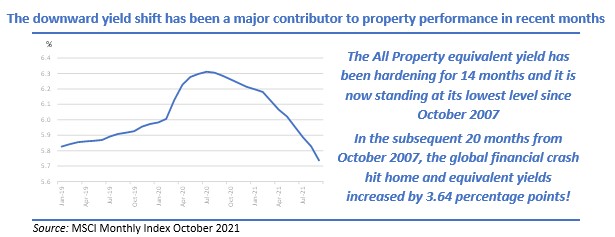
Commercial property has benefited from the recent period of ultra-low interest rates. All property yields are now declining, reversing the long upward yield trajectory. At a time when rental growth outside the industrial sector has been hard to find, the downward yield shift has been the major contributor to the market performance. MSCI’s Monthly Property Index (which is not as representative of the market as the much larger Quarterly Index) indicates that the yield shift in the month of September alone (which added 1.5 percentage points (pps) to total returns) was the largest single month’s contribution for almost eight years. The Quarterly Index concurred with this feature: yield shift in Q3 added 2.5 pps to the all property total returns. For once, it was not just the industrial sector that was the main beneficiary of this downward yield shift: it added no less than 5.8 pps to retail warehouse5s’ total return in the quarter.
According to the Quarterly Index, over the last 12 months (from the start of yields hardening at the all property level, the yield impact factor alone has added 6 pps to capital returns while the yield impact on the industrial sector has added an astonishing 17 pps in that period. As the all property capital growth over these four quarters amounted to the same 6%, one can readily see how much property performance has been driven by the inward yield movement. For the industrial sector, capital returns amounted to 22% over that period, again highlighting the importance of yield shift to overall performance.
Clearly, these downward yield movements are unsustainable going forward, even if the economy were firing on all cylinders. But it is not, and with gilt yields already on the way up, it would be unrealistic to expect property yields not to do the same. That said, we do not anticipate property yields will rise materially any time soon and we are of the opinion that any base rate increases will be moderate: we expect the Bank of England’s base rate to be at or below 1% at the end of next year, which should therefore limit any increase in property yields. Outperformance during a period of rising property yields would require rental growth and bar for the industrial sector, and perhaps the retail warehouse sector, there are few parts of the market with that prospect over the near term. The one caveat to our mildly encouraging view that any upward property yield movement will be limited and delayed is that in this more connected investment landscape, once the market senses a change of sentiment, yields can and do move very quickly.
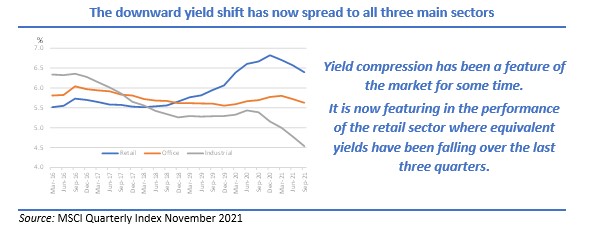
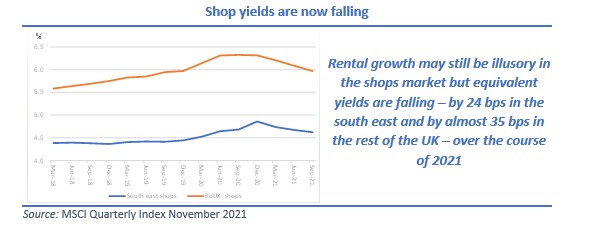
In terms of performance, there has been a notable shift in emphasis over the last couple of quarters. Industrial assets have delivered the best total returns of all the main sectors for 23 consecutive quarters – almost six years – a record that shows no sign of ending. Retail had been the weakest sector by far until Q2 2021 when it overtook the office sector in total returns. No-one can suggest that all retail’s problems are in the past but investors, at least, are taking the view that the parts of the sector are beginning to offer better value. Rental growth remains illusory still but yield compression has been a feature of the retail sector now for nine months. At the sector level, all retail equivalent yields have fallen by 42 bps over 2021 to date, partly reversing a rise of 130 bps (over 1¼%) over the previous three years. That yield compression is due to the weight of money chasing retail assets.
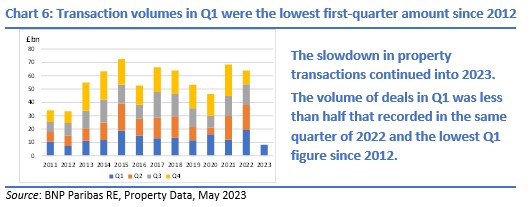
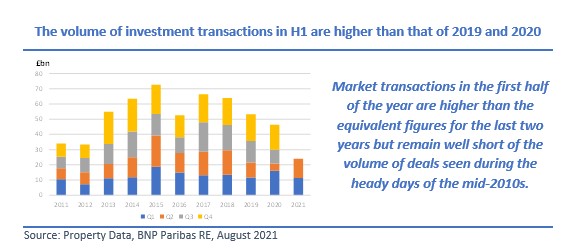
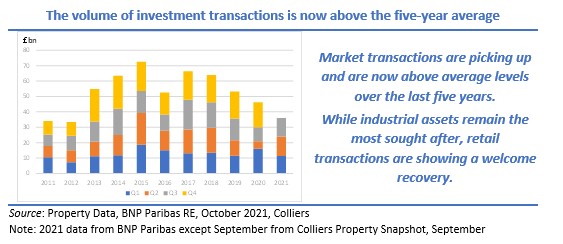
Investment volumes for the market as a whole continue to rise. Although September recorded a slightly lower volume of deals than in the previous month, the year-to-date figure of approaching £40bn is not just above that of the equivalent figures for 2019 and 2020, it is in line with the five-year average.
Again highlighting the improved sentiment towards the sector, monthly retail transactions hit a year’s high in September. Deals in that month alone reached £755m, 38% above the five-year monthly average. Not only were retail warehouses in demand, there has been a welcome improvement in investor interest in shopping centres and supermarkets. Shopping centre deals remain well below the pre-pandemic norms, but investors are viewing supermarkets as one of the must have segments. Retail warehouses, too, are currently back in favour with investors
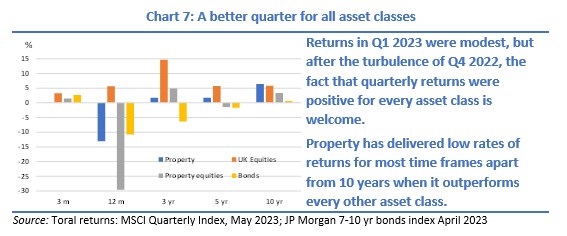
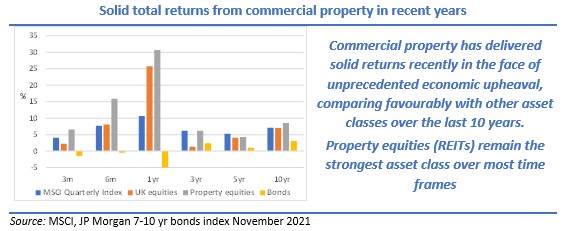
The sustained investor demand has ensured that total returns from commercial property remain highly competitive against other domestic asset classes. Indeed, over the last decade, commercial property has delivered higher returns than those of UK equities and government bonds. Commercial property outperforming equities and bonds over such a long period is unusual and it would be a brave investor who believes that will happen over the coming 10 years. Also note the recent strong performance of property equities (REITs) which is often a leading indicator of the performance of direct property.
The 10-year property total returns of 7.1% pa are attributable mostly to income returns and yield compression, which together accounted for 96% of these returns – the balance being from rental growth, predominantly from industrial assets. Almost three-quarters (72%) has derived from income returns and just 2 percentage points pa has come from capital growth and of that yield compression has been by far the most significant factor. Yield movement has been even more marked in returns over the last three years.
Over the last 20 years, the average annual total return of 7.1% (coincidently the same as for the 10-year performance) has comprised 5.6% for income and 1.4% from capital. However, in another warning over the sustainability of the current returns, the income return over Q3, at 1.09%, is the lowest in the Quarterly Index’s history. Even lower than during the run-up to the global financial crash.
Far from being pushed down the financial agenda during the challenging times most businesses have been facing, ESG (environment, social and governance) issues have actually become more important for many. There are many facets to this topic. One key aspect is that many tenants’ occupational requirements are now demanding ‘greener’ properties, whether that be in their construction or in having a lower carbon footprint. It is too early to postulate, but it will be interesting to see in the future, not if there is a ‘green premium’ to such properties, but how big the premium becomes.
The industrial sector
The sector continues to deliver remarkable rates of return. Average capital growth of industrial assets of 6.45% in the quarter gives rise to a 12-month sector growth of 24%. Not once before in the history of the Quarterly Index has an annual rate of capital growth of any sector been this high.
It is not difficult to comprehend the reasons behind this phenomenal rate of growth, which we have highlighted in previous reports: the pandemic-induced switch from physical shopping to online with strategically placed distribution hubs being key to the success of the growth of the online model. Take up of industrial space hit a record high in 2020 at almost 50m sq ft (Source: Colliers Data Bites October 2021) and with 44m sq ft already let, this year seems set to exceed that total.
This increase in take up, having doubled in the last decade is directly affected by the increase in online sales over that period.
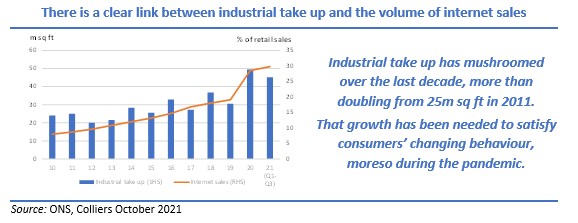
Online sales have been growing for years, but this means of sales received a further boost last year during the periods of lockdown. Clearly the rate of growth in online sales will slow from the breakneck speed seen over the last 18 months, but online sales are here to stay.
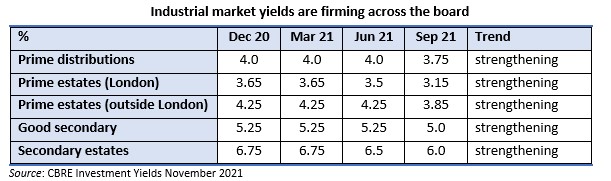
Considering only the large (100,000 sq ft) + units, Q3 take-up topped 11m sq ft, resulting in a year-to-date figure of 33m sq ft. Although down 11% from last year’s record level, this is still the second strongest Q1-Q3 figure on record. Demand for grade A space has dominated so far this year, but there has also been a major uptick for take-up of speculatively developed units. This is driven by a lack of available space and occupiers’ need to quickly fulfil their requirements. Current supply at the end of September stood at roughly 20m sq ft, the lowest ever seen in the sector and a decline of 38% compared to a year ago. An ongoing lack of supply may hamper future activity and pre-lets are likely to become even more prevalent to satisfy occupier requirements.
There is one crucial risk factor that one has to bear in mind with distribution warehouses. There has been a huge increase in the number of these built and occupied over the last couple of years. Some will be occupied on the back of (largely) one key contract won with a supermarket chain, for example. That contract will be for a specified number of years and there is no guarantee that the contract with that company will be extended, highlighting the potential risk of these units falling empty at the end of the contract.
The retail sector
It is rarely that one can has been able to paint a positive picture on the beleaguered retail sector but, ever so slowly, both investment and just as importantly tenant demand seem to be heading in an upward direction.
Average shop values are now rising for the first time in over three years while even the hard-pressed shopping centre segment saw the decline in average values fall to a tiny 1% in Q3 – a welcome change after values have more than halved over the last six years.
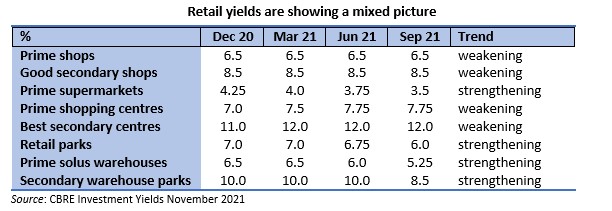
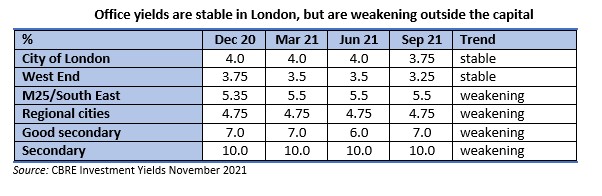
Retail warehouses stand out, however, in what has been, until recently, a tide of red. Buoyed by some consumers’ preference to visit retail parks rather than face shopping in indoor malls or crowded high streets, these units have seen some spectacular growth over the last six months. Average retail warehouse capital values have risen 7.5% over the last six months. This increase is purely yield driven: rental values are static while the equivalent yield has hardened by a significant 68 bps to 6.8% over that timescale. The table below indicates that CBRE believe that there is further downward yield shift to come.
Shop yields, too, have started to edge lower this year. Despite rents still drifting lower, this yield shift was enough to ensure that average shop values increased over Q3. Of concern here, though, is the continual increase in shop vacancies. More than one in eight shops are vacant in central London while the vacancy rate nationwide is now over 10%. Landlords and local authorities will have to do some serious thinking if the high street is ever to return to its vibrant past.
The one retail segment that has not yet seen average values rising is shopping centres. Vacancy rates are rising here as well while rents are still heading south but the 0.8% fall in Q3 was the lowest quarterly decline in 3½ years.
While the outlook for the retail sector remains challenging, there are clear signs that investors are now starting to reconsider the sector as offering better value. Shopping centres, however, are certainly not in that category, yet.
One example of the way the high street is adapting to changing customer habits is Ikea’s purchase in October of the former Top Shop building on Oxford Street, London for £378m. Amounting to 239,000 sq ft of office and retail accommodation, the seven-storey store will be the furniture giant’s first UK city centre store, following openings in New York, Tokyo and Madrid. Several more are in the pipeline. It is due to open in 2023 and will focus on home-furnishing accessories, with the full range available to buy for home delivery.
The office sector
Take up across the UK increased to 1.3m ft over Q3 adding to the 2m sq ft take up over the first half of the year. This total take up in the first nine months of the year was just two-thirds of the average level of take up over the last five years but it is an improvement on the position at the end of June. The business services sector was the most active occupier during Q3, accounting for a quarter of all space let, but the biggest letting in Q3 was the 75,000 sq ft office at Buchanan Wharf, Glasgow which was let to The Student Loans company.
Including investment transactions in central London (which is covered in the next section), deals across the UK for the first nine months of the year totalled £11.1bn (Source: Colliers Property Snapshot, October), well up on last year’s Q1-Q3 £8.1bn. September was also the fifth month in a row than investment exceeded £1bn.
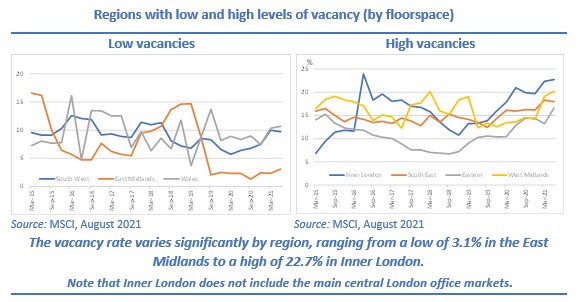
The regional office market has been much stronger than that of the south east. Rents have been growing for eight successive quarters and rental growth over 2021 to date is a fairly respectable 3.1%. However, vacancies are rising here too but at 12.5%, the vacancy rate of the regional office market is well below that of the south east where more than one in six offices now lie empty.
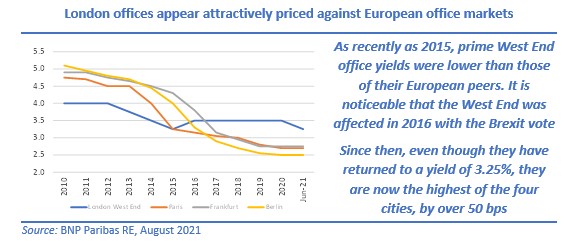
Central London offices
As business returns to some sort of normality, so too are occupiers re-activating their office requirements.
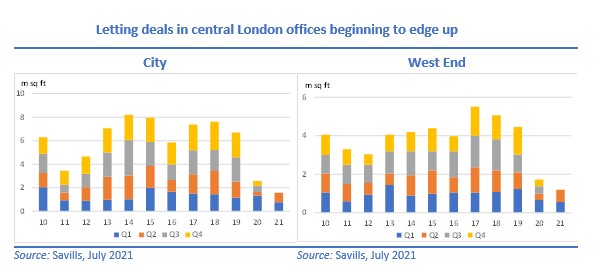
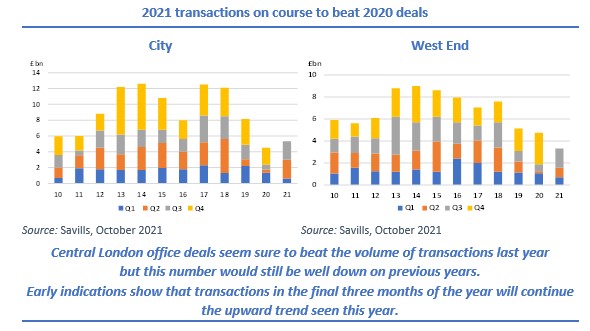
Third quarter take up in both central London sub-markets recorded the largest quarterly figures since the onset of the pandemic although data from the West End was significantly stronger than that from the City. For the former, take up in September was the highest monthly figure since 2019, helping Q3 to record the highest quarterly take up for three years. The City data, in contrast, was much weaker: September’s take up, at just 136,000 sq ft, was the lowest monthly figure this year, taking Q3 to just over 1m sq ft, up on last year’s equivalent figure but still the second lowest in the last decade.
In addition to renewed take up activity, the amount of space under offer is significantly higher than in the past. A total of 3.6m sq ft of office space is currently under offer in central London, noticeably higher than the long-term averages in both sub-markets. Adding to these positive statistics, active requirements currently exceed 10m sq ft. This all indicates that take up in Q4 and into 2022 will remain strong.
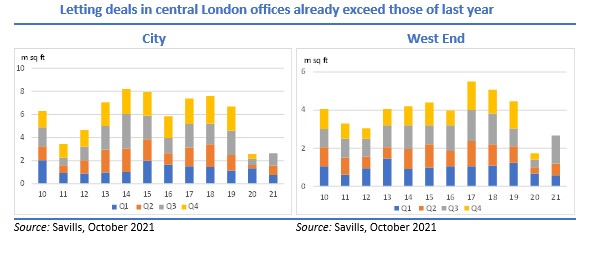
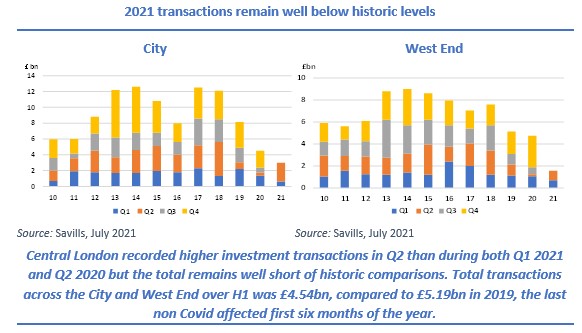
Meanwhile investment transactions seem to be returning to pre-pandemic levels. Still the focus of many income seekers, commercial property fits the bill while large, central London offices, also being relatively liquid, have been particularly sought after. Over £4bn of London office deals were recorded in the third quarter of the year meaning that £8.7bn has been transacted this year, double the amount of the equivalent nine months last year.
The City market has been noticeably busier. As well as deals worth £2.34bn being concluded in Q3, there are currently 18 other properties, valued at £2.15bn, under offer with a further 62 others being openly marketed. Already, transactions this year have exceeded the value transacted over the whole of 2020 and it seems likely that the total amount of deals that will conclude this year could nudge the 10-year average of £9.5bn.
While the volume of deals in the West End is somewhat less than that for the City, Q3 transactions of £1.76bn exceeded the value transacted during preceding six months of the year. As with its eastern neighbour, there has been a flurry of openly marketed properties over the summer with a further 25 with a value of £1.23bn having been launched on the market during September and early October. Q4, traditionally the strongest quarter for deals, looks likely to build on the momentum of Q3.
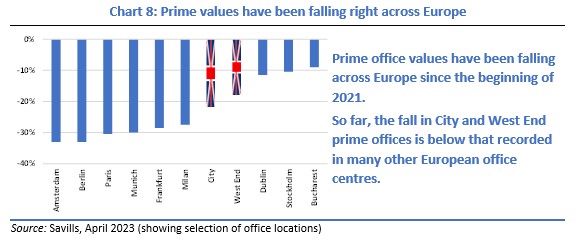
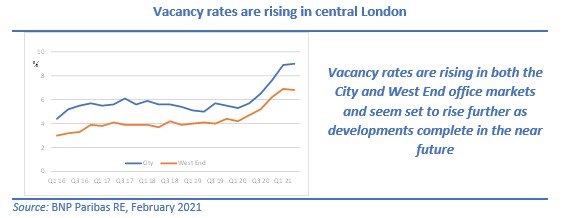
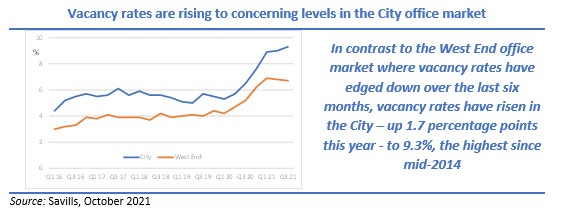
It is necessary to highlight the marked rise in available space. The West End manged to buck the rising trend in Q3 but even so, the vacancy rate there of 6.7% is well above levels recorded in the recent past. But it is the City office market which is beginning to pose real problems. A further jump of 30 bps to 9.3% has moved the City’s vacancy rate 2.8 percentage points higher than it was a year previously.
These statistics are estimates from Savills, but data from MSCI paints an even gloomier picture. Q3 data shows that the vacancy rate of City offices has reached a 12-year high at 16.5% while the West End has increased to a three year high. It is necessary to point out that the agent’s figures may be a truer guide to the actual position as not all properties feature in the MSCI performance measurement statistics. Irrespective of whichever measure paints the more accurate picture, it is clear that the current level of vacant properties is sure to increase in the coming quarters as developments come on stream and take up remains relatively muted.
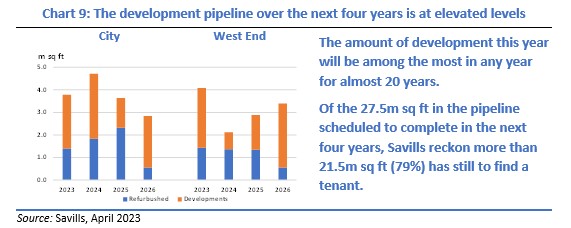
Currently, there is a total of almost 21m sq ft space available in the two markets (13m sq ft in the City and 7.8m sq ft in the West End). It is estimated that over the coming four years, a total of 27.3m sq ft of new developments will be completed in central London (15m in the City and 12m in the West End). Of that total, only 3m sq ft has been pre-let implying that, on current build estimates, over 24m sq ft of office space will be completed speculatively. That is a lot of potential space to let, leading to even higher than current vacancy levels and limited rental growth – if any. As mentioned in previous reports, delays caused by worker and material shortage may be one saving grace from the pandemic effects, thereby reducing the actual amount of space completed.
MSCI statistics show that rents in both sub markets have been flat over the course of the year. Agents’ data point to a more bullish outcome with average Grade A rents up since the start of the year by £2 per sq ft (psf) in the City and by £7 psf in the West End to £67 and £82 respectively. Grade B space has also seen growth in both markets this year.
However, as with other segments of the property market, yield compression rather than rental movements was the driver of capital growth in Q3. MSCI revealed that City yields moved in by 10 bps (from 5.26% to 5.16%) and West End yields by 2 bps (from 4.6% to 4.58%). Bar for a brief spell in 2018, City yields have never been that low since March 2007 – just before the GFC.
All investment and take up data and statistics from Savills, unless stated; all performance statistics from MSCI; all graphs by the author.
Stewart Cowe, November 2021